
1. Moving the Markets
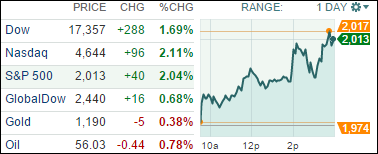
Today’s trading closed with smiles on most everyone’s face in Wall Street as the Dow and S&P 500 had one of their best point gains of the year. The Dow gained 1.69%, the S&P 500 rose a whopping 2.04% and the Nasdaq rose ahead of the pack gaining 2.11%!
Markets were driven higher today by news of oil prices and the Russian ruble stabilizing, but primarily by news that the Federal Reserve is on course to raise rates for the first time since 2006 — but likely won’t hike short-term rates any earlier than the middle of next year. Needless to say, investors liked what they heard.
Policymakers released forecasts today which show they now expect the Fed’s benchmark short-term rate to rise a bit more slowly than they predicted in September. The rate is now expected to be about 1.1% at the end of 2015 and about 2.4% at the end of 2016, below their earlier estimates of 1.3% and 2.8%.
In tech news, Oracle’s (ORCL) stock got a pop today after delivering its quarterly earnings and revenue numbers that topped analyst expectations. Investors are excited because the company has turned around from a three-quarter losing streak, mostly due to its inability to catch up with other competitors in the cloud and software space.
With the broad advance, it’s no surprise that all of our 10 ETFs in the Spotlight rallied; however, no new highs were made as this rebound merely improved the standing in the “Off High” column shown in section 3.
2. ETFs in the Spotlight
In case you missed the announcement and description of this section, you can read it here again.
It features 10 broadly diversified ETFs from my HighVolume list as posted every Monday. Furthermore, they are screened for the lowest MaxDD% number meaning they have been showing better resistance to temporary sell offs than all others over the past year.
Here are the 10 candidates:
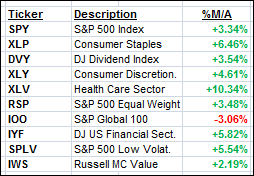
The above table simply demonstrates the magnitude with which some of the ETFs are fluctuating in regards to their positions above or below their respective individual trend lines (%M/A). A break below, represented by a negative number, shows weakness, while a break above, represented by a positive percentage, shows strength.
For additional ETF selections please review my weekly StatSheet, which is updated and posted every Thursday night.
Year to date, here’s how the above candidates have fared so far:
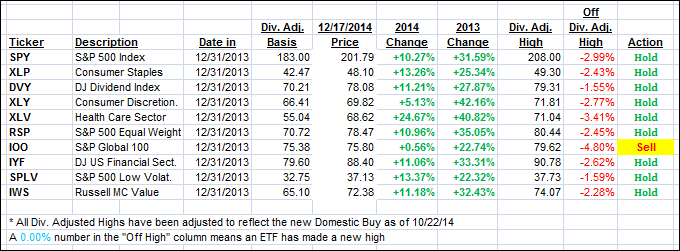
Again, the first table above shows the position of the various ETFs in relation to their respective long term trend lines (%M/A), while the second one tracks their trailing sell stops in the “Off High” column. The “Action” column will signal a “Sell” once either the -7.5% point has been taken out in the “Off High” column or the respective Trend Tracking Index has moved into bear market territory.
3. Trend Tracking Indexes (TTIs)
Our Trend Tracking Indexes (TTIs) joined the rebound party and moved higher with the International one still remaining stuck on the bearish side of its long term trend line.Here’s how we ended this best day of the year:
Domestic TTI: +1.72% (last close +1.17%)—Buy signal since 10/22/2014
International TTI: -1.89% (last close -2.48%)—New Sell signal effective 12/15/14
Disclosure: I am obliged to inform you that I, as well as advisory clients of mine, own some of these listed ETFs. Furthermore, they do not represent a specific investment recommendation for you, they merely show which ETFs from the universe I track are falling within the guidelines specified.
Contact Ulli