
1. Moving the Markets
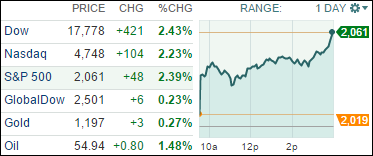
Wall Street was on fire for a second straight day today as investors remained exuberant about news of continued low interest rates and low oil prices. The Dow gained 421 points today (+2.43%), marking a gain of almost 600 points in the past two trading sessions. The S&P added 2.4% and the Nasdaq rose 2.24%. It seems that markets are again remembering the basics: low interest rates, low inflation, and an alleged gradual economic recovery equal a bull market for equities; at least that’s how the theory goes. However, let’s not forget that this rally merely made up the the losses sustained earlier in the month; the S&P is still slightly below its level of November 28th.
European markets were also back on track, reassured also by the Fed’s comments. Low interest rates here in the U.S. also benefits Eurozone companies, because a healthy U.S. economy provides a demand boost to Eurozone firms that sell goods and services to Americans. The CAC 40 of France jumped 3.4% and Germany’s DAX added 2.8%. The FTSE of Britain gained 2%.
In earnings news, Rite Aid (RAD) shares popped today after the drugstore chain reported third-quarter earnings that clearly topped analyst expectations. Rite Aid reported revenues of $6.7 billion, up from $6.4 billion for the same quarter last year, on net income of $104.8 million. Shares gained 11.9% respectively.
Let’s hope the bulls will keep charging ahead through the holidays.
Again, all of our 10 ETFs in the Spotlight joined the upswing with 2 of them making new highs in the process.
2. ETFs in the Spotlight
In case you missed the announcement and description of this section, you can read it here again.
It features 10 broadly diversified ETFs from my HighVolume list as posted every Monday. Furthermore, they are screened for the lowest MaxDD% number meaning they have been showing better resistance to temporary sell offs than all others over the past year.
Here are the 10 candidates:
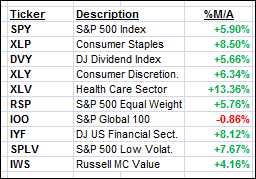
The above table simply demonstrates the magnitude with which some of the ETFs are fluctuating in regards to their positions above or below their respective individual trend lines (%M/A). A break below, represented by a negative number, shows weakness, while a break above, represented by a positive percentage, shows strength.
For additional ETF selections please review my weekly StatSheet, which is updated and posted every Thursday night.
Year to date, here’s how the above candidates have fared so far:
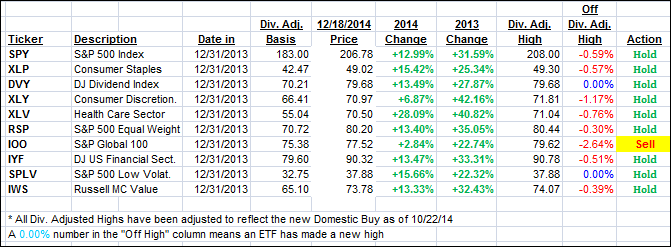
Again, the first table above shows the position of the various ETFs in relation to their respective long term trend lines (%M/A), while the second one tracks their trailing sell stops in the “Off High” column. The “Action” column will signal a “Sell” once either the -7.5% point has been taken out in the “Off High” column or the respective Trend Tracking Index has moved into bear market territory.
3. Trend Tracking Indexes (TTIs)
Our Trend Tracking Indexes (TTIs) improved as the rally continued. The International one, however, remains on the bearish side of its long-term trend line; at least for the time being.
Here’s how we ended this extremely bullish day:
Domestic TTI: +3.19% (last close +1.72%)—Buy signal since 10/22/2014
International TTI: -0.65% (last close -1.89%)—New Sell signal effective 12/15/14
Disclosure: I am obliged to inform you that I, as well as advisory clients of mine, own some of these listed ETFs. Furthermore, they do not represent a specific investment recommendation for you, they merely show which ETFs from the universe I track are falling within the guidelines specified.
Contact Ulli