Weekly StatSheet For The ETF/No Load Fund Tracker Newsletter – Updated Through 07/30/2015

Ulli ETF StatSheet Contact

ETF/Mutual Fund Data updated through Thursday, July 30, 2015

TOC021915

If you are not familiar with some of the terminology used, please see the Glossary of Terms.


1. DOMESTIC EQUITY MUTUAL FUNDS/ETFs: BUY — since 10/22/2014

TTI

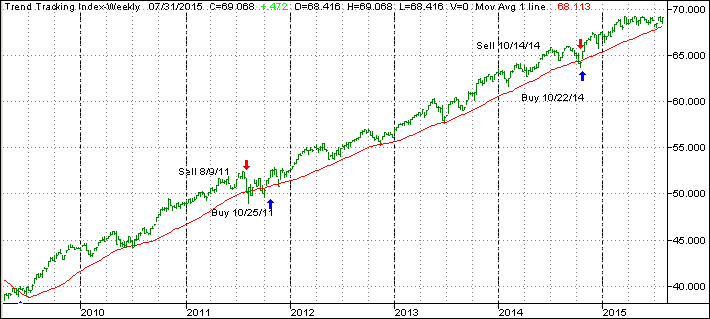
Our main directional indicator, the Domestic Trend Tracking Index (TTI), broke through its long-term trend line generating a “Sell” for this arena effective 10/14/2014, which was followed by a violent break back above the line on 10/22/14 generating a new “Buy.” It was a classic whipsaw signal, and you can read more on my blog as to the events as they were unfolding.

As of today, our TTI (green line in above chart) is positioned above its long term trend line (red) by +1.50% keeping us in the market with our established positions.

Read More

Treading Water

Ulli Market Commentary Contact

Thur pic

[Chart courtesy of MarketWatch.com]

1. Moving the Markets

At the end of the trading session, the S&P 500 had hardly moved, despite some volatility early on, as the chart above shows. A mixed earnings picture pretty much cancelled out any positive or negative effect on the indexes.

It looks like we’re still stuck in a wide sideways pattern with the upper end being the 2,130 level of the S&P. If we break through this glass ceiling, we may see new upward momentum develop; if not, we may just be stuck in that range for a while longer. The Fed and the earnings season have so far not provided enough ammunition for a break out.

Today’s widely expected and revised GDP report came in at a 2.3% annual rate, while the revision of 0.6% for the 1st quarter reversed the original contraction. Consumer spending rose more than expected while applications for unemployment benefits headed higher.

7 of our 10 ETFs in the Spotlight eked out a gain led by Consumer Discretionaries (XLY) with +0.36%, while Consumer Staples (XLP) slipped and lost -0.34%.

Read More

Bulls Extend Market Rally

Ulli Market Commentary Contact

Wed pic

[Chart courtesy of MarketWatch.com]

1. Moving the Markets

The bulls were clearly in charge, and the major indexes managed to build on yesterday’s gains with the S&P 500 pushing through the 2,100 level again by adding another 0.75%.

Despite the same old useless jawboning by the Fed about their intentions, or lack thereof, of hiking rates in the fall, traders simply assumed that no announcement basically confirms that the economy is not firing on all cylinders and does not warrant an increase in rates—at least, that’s the view for the time being.

While the indexes briefly dipped after the Fed announcement, buying resumed and we climbed steadily for the remainder of the session. All of the 10 S&P sectors closed above the unchanged line with the leaders being industrials and energy.

In a repeat performance from yesterday, all of our 10 ETFs in the Spotlight closed up again led by the Mid-Cap Value (IWS) with +1.09%. Lagging the bunch was Healthcare (XLV) with a meager +0.17% gain.

Read More

Reversing the Slide

Ulli Market Commentary Contact

Tue pic

[Chart courtesy of MarketWatch.com]

1. Moving the Markets

The major indexes managed to put a stop to the worst pullback since January as the markets simply got oversold. Helping to a good start early on were better-than-expected earnings by UPS and Pfizer while energy shares found some momentum to the upside and even copper managed to pull itself out of the doldrums. Let’s hope it wasn’t just a dead cat bounce.

China’s big sell off from yesterday slowed with their equities “only” losing 1.7% today, but it was enough of a positive to lend the U.S. and European markets some support; the domestic major indexes never looked back as the chart above shows.

The S&P 500 had given back some 2.9% in the past five sessions as a mix of things ranging from weak earnings to bearish news out China combined to pull the momentum out from under the bulls. On the front burner right now is the 2-day Fed meeting, which ends tomorrow with all eyes being feasted on their report indicating as to when interest rates allegedly will be raised—or not.

All of our 10 ETFs in the Spotlight enjoyed this turnaround day and closed in the green. Leading to the upside was Healthcare (XLV) with +1.81%, while the Financials (IYF) lagged a little with +0.51%.

Read More

Chinese Stocks Drop 8.5%—Domestic Equity Slide Continues For 5th Day

Ulli Market Commentary Contact

Mon pic

[Chart courtesy of MarketWatch.com]

1. Moving the Markets

Blame it one the Chinese. With the Shanghai index tanking some 8.5% in today, there was simply no other way to go but down. European stocks took the clue, and the German DAX dropped 2.6%. Following the leaders, the bears quickly took the upper hand in the U.S. markets and down we went, although in far more moderate fashion with the S&P surrendering 0.56% but still staying above the level we finished the month of June.

China’s situation is cause for concern since a lot of international companies rely on that huge market to sell their products. Any weakening demand will affect the future earnings picture here in the U.S. This morning’s report that industrial profits in China fell in June followed Friday’s data showing a private manufacturing index declining to a 15-month low; both are signs that growth appears to stall.

Again, there were no winners today, with the exception of the Select Dividend ETF (DVY), which actually gained 0.09% in the face of adversity. Still, it’s the loser of the year with some -4%. Leading the downside were the Financials (IYF) with -0.78%.

Read More

ETFs/Mutual Funds On The Cutline – Updated Through 07/24/2015

Ulli ETFs on the Cutline Contact

Below are the latest ETF Cutline reports, which show how far above or below their respective long-term trend lines (39 week SMA) my currently tracked ETFs/MFs are positioned.

The first report covers the ETF Master List from Thursday’s StatSheet and includes 410 ETFs, of which currently 150 (last week 212) are hovering in bullish territory.

The second report includes only High Volume ETFs. To clarify, High Volume (HV) ETFs are defined as those with an average daily volume of $10 million or higher.

These ETFs are generated from my selected list of some 97 that I use in my advisor practice. It cuts out the “noise,” which simply means it eliminates those ETFs that I would never buy because of their volume limitations. 24 ETFs (last week 38) have managed to remain in bullish territory after the recent market volatility.

The third report covers Mutual Funds on the Cutline. There are currently 318 (last week 379) above the line and 502 below it out of the 820 that I follow.

Take a look:

  1. ETF Master Cutline Report
  2. ETF High Volume Cutline Report
  3. MF Cutline Report

In case you are not familiar with some of the terminology used in the reports, please read the Glossary of Terms.

If you missed the original post about the Cutline approach, you can read it here.