Weekly StatSheet For The ETF/No Load Fund Tracker Newsletter – Updated Through 10/08/2015

Ulli ETF StatSheet Contact

ETF/Mutual Fund Data updated through Thursday, October 8, 2015
TOC 090315

If you are not familiar with some of the terminology used, please see the Glossary of Terms.


1. DOMESTIC EQUITY MUTUAL FUNDS/ETFs: SELL — since 8/24/2015
TTI

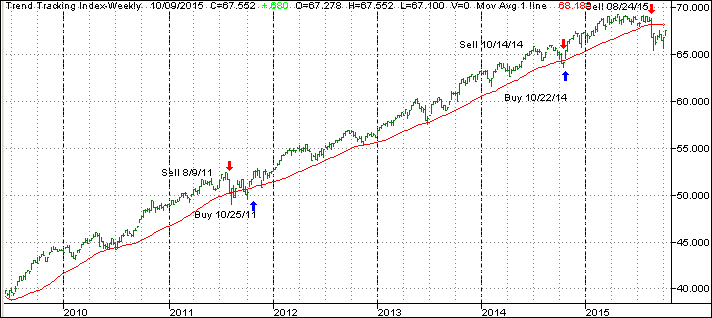
Our main directional indicator, the Domestic Trend Tracking Index (TTI), broke through its long-term trend line generating a “Sell” for this arena effective 10/14/2014, which was followed by a violent break back above the line on 10/22/14 generating a new “Buy.” It was a classic whipsaw signal, and you can read more on my blog as to the events as they were unfolding.

As of today, our TTI (green line in above chart) is positioned below its long term trend line (red) by -0.91% after having generated a “Sell” signal as of 8/24/2015, which applies to all “broadly diversified domestic equity ETFs/Mutual Funds.”
Read More

Rally Continues On Wall Street; Alcoa Disappoints

Ulli Market Commentary Contact

Thur pic

[Chart courtesy of MarketWatch.com]

1. Moving the Markets

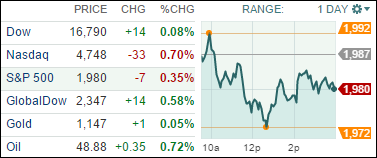
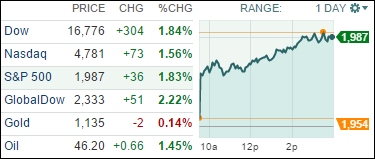
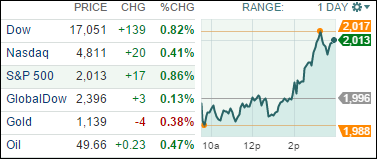
The stock rally on Wall Street picked up steam Thursday as investors focused on the Federal Reserve’s continued worries about low inflation after the release of minutes from the Fed’s latest policy meeting.

The Dow and S&P 500 had earlier flirted above and below the break-even marks of 17,000 and 2,000. But after reviewing the Fed minutes, in which the central bank said it was still worried about low inflation readings, stocks rallied as the odds for an interest rate hike this year seemed to shrink some more.

We have all been waiting for the earnings season to get underway. Today, Alcoa (AA) released its Q3 numbers not long after the closing bell. The results were disappointing. The company reported adjusted earnings per share of $0.07 ($0.13 estimated) and revenues of $5.6 billion ($5.64 billion expected), down 11% year-on-year. Alcoa is seen as a gauge for global manufacturing and as a big player in commodities. Its performance, comments on the markets and on China’s economy are telling.

All of our 10 ETFs in the Spotlight joined the party and closed up with the Mid-Cap Value being the winner with +1.25%. Lagging behind was Healthcare again (XLV) with +0.37%.

Read More

Stocks Close Higher Despite Morning Slide

Ulli Market Commentary Contact

Wed pic

[Chart courtesy of MarketWatch.com]

1. Moving the Markets

After nosing into the red in late-morning trading, all three major benchmarks climbed back into the black to close the day. Analysts are eyeing the key 2000 level on the S&P 500 index, as that level now is viewed as a ceiling of sorts for stocks as they look to rebound further. A break above 2000 would boost hopes that the uptrend that began Friday has legs and that the market is regaining its bullish stance.

Today, traders were also bracing for the unofficial start of the third-quarter earnings season, which kicks off with very low expectations Thursday when aluminum maker Alcoa (AA) reports. For the third straight month, the profit-reporting season begins with Wall Street analysts predicting a contraction in earnings.

A possible market-moving event occurs Thursday, when the Fed releases the minutes of its September meeting. Stocks, of course, have been hurt by uncertainty surrounding the start of rate hikes, but have recently gotten a boost after Friday’s weak jobs report resulted in Wall Street pushing out the so-called Fed “lift-off” into early 2016.

It was a wild ride, but all of our 10 ETFs in the Spotlight participated in the reboud and closed higher. The leader of the day was Healthcare (XLV), which added +1.53%. Lagging the group was Consumer Discretionaries (XLY) with +0.31%.

Read More

Markets Mixed While Awaiting Earnings Season

Ulli Market Commentary Contact

Tue pic

[Chart courtesy of MarketWatch.com]

1. Moving the Markets

After a strong five-day rally that lifted the major U.S. stock indexes well off their lows hit in August, equities ended mixed as Wall Street reassessed the outlook for stocks for the rest of 2015.

Healthcare stocks led the decline in the S&P, while a rally in Dupont’s stock (DD) helped keep the Dow in positive territory. Healthcare stocks have had a tough year that is mostly due to the widespread scrutiny over high prices for pharmaceuticals.

Investors are still anxious in waiting for the earnings season to kick off later this week. At present, expectations are low, but many analysts think that this could actually be beneficial for the indexes if stocks outperform. It is a critical time to see how the markets will react to earnings reports, especially since the S&P 500 keeps flirting with the 10% correction status.

And in economic news, we heard today that the U.S. trade deficit jumped sharply in August as exports fell to the lowest level in nearly three years while imports increased, led by a surge in shipments of cellphones from China. The deficit increased 15.6% to $48.3 billion, the biggest since March, the Commerce Department reported Tuesday.

Only 2 of our 10 ETFs in the Spotlight managed to eke out a gain with the Global 100 (IOO) taking the top spot by adding +0.42%. The loser of the day turned out to be Healthcare (XLV) which got clobbered at the tune of -2.35%. Ouch.

Read More

Stocks Roar Back; American Apparel Business Model Fails

Ulli Market Commentary Contact

Mon pic

[Chart courtesy of MarketWatch.com]

1. Moving the Markets

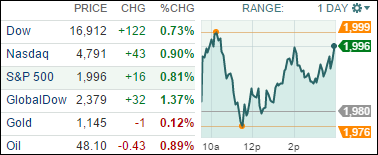
Stocks kicked off the week in rally mode Monday as investors view a Federal Reserve interest rate hike this year as less likely after Friday’s weak jobs report raised questions about the pace of U.S. growth.

Third quarter earnings season kicks off this week when Alcoa (AA) reports on Thursday. Analysts are predicting a decline of 4.8% for S&P 500 companies, which would be the first quarter-over-quarter profit decline since 2009.

The culprit for market declines is largely pointing towards the energy sector. Companies in the energy sector are expected to post 60% lower profits for Q3, which is mainly due to a 50% drop in oil prices from this time last year. Don’t let these numbers fool you though, because energy companies skew the numbers. Excluding energy sector stocks, corporate profits are on track to be growing 3.5%, according to S&P capital IQ.

In other corporate news, we heard today that American Apparel (APP) has filed for bankruptcy, after its made-in-the-U.S. model faltered, its fashion sense slipped and its controversial former CEO became embroiled in scandal over his behavior in the workplace. The company, which flirted with bankruptcy as early as 2011, has about 8,500 employees at six factories and 230 stores in the U.S. and 17 and it famously bet its business model on clothing made in the U.S.

Continuing Friday’s theme, all of our 10 ETFs in the Spotlight rallied and closed higher with the leader being the MidCap Value (IWS), which added +2.14%. The laggard for the day was Healthcare (XLV) with +0.26%.

Read More

ETFs/Mutual Funds On The Cutline – Updated Through 10/2/2015

Ulli ETFs on the Cutline Contact

Below are the latest ETF Cutline reports, which show how far above or below their respective long-term trend lines (39 week SMA) my currently tracked ETFs/MFs are positioned.

The first report covers the ETF Master List from Thursday’s StatSheet and includes 381 ETFs, of which currently 18 (last week 10) are hovering in bullish territory.

The second report includes only High Volume ETFs. To clarify, High Volume (HV) ETFs are defined as those with an average daily volume of $10 million or higher.

These ETFs are generated from my selected list of some 97 that I use in my advisor practice. It cuts out the “noise,” which simply means it eliminates those ETFs that I would never buy because of their volume limitations. 4 ETFs (last week 3) have managed to remain in bullish territory after the recent market volatility.

The third report covers Mutual Funds on the Cutline. There are currently 15 (last week 17) above the line and 785 below it out of the 800 that I follow.

Take a look:

  1. ETF Master Cutline Report
  2. ETF High Volume Cutline Report
  3. MF Cutline Report

In case you are not familiar with some of the terminology used in the reports, please read the Glossary of Terms.

If you missed the original post about the Cutline approach, you can read it here.