
1. Moving the Markets
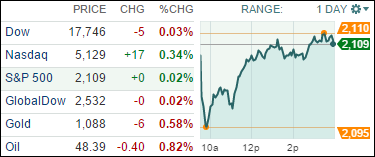
At the end of the trading session, the S&P 500 had hardly moved, despite some volatility early on, as the chart above shows. A mixed earnings picture pretty much cancelled out any positive or negative effect on the indexes.
It looks like we’re still stuck in a wide sideways pattern with the upper end being the 2,130 level of the S&P. If we break through this glass ceiling, we may see new upward momentum develop; if not, we may just be stuck in that range for a while longer. The Fed and the earnings season have so far not provided enough ammunition for a break out.
Today’s widely expected and revised GDP report came in at a 2.3% annual rate, while the revision of 0.6% for the 1st quarter reversed the original contraction. Consumer spending rose more than expected while applications for unemployment benefits headed higher.
7 of our 10 ETFs in the Spotlight eked out a gain led by Consumer Discretionaries (XLY) with +0.36%, while Consumer Staples (XLP) slipped and lost -0.34%.
2. ETFs in the Spotlight
In case you missed the announcement and description of this section, you can read it here again.
It features 10 broadly diversified ETFs from my HighVolume list as posted every Monday. Furthermore, they are screened for the lowest MaxDD% number meaning they have been showing better resistance to temporary sell offs than all others over the past year.
Here are the 10 candidates:
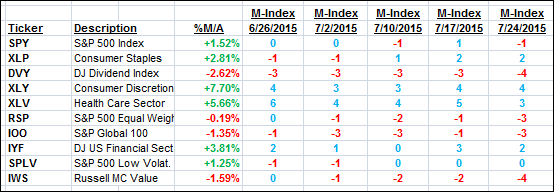
The above table simply demonstrates the magnitude with which some of the ETFs are fluctuating in regards to their positions above or below their respective individual trend lines (%M/A). A break below, represented by a negative number, shows weakness, while a break above, represented by a positive percentage, shows strength.
For hundreds of ETF/Mutual fund choices, be sure to reference Thursday’s StatSheet.
Year to date, here’s how the above candidates have fared so far:
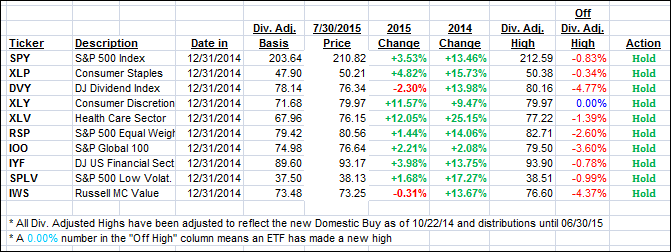
Again, the first table above shows the position of the various ETFs in relation to their respective long term trend lines (%M/A), while the second one tracks their trailing sell stops in the “Off High” column. The “Action” column will signal a “Sell” once the -7.5% point has been taken out in the “Off High” column.
3. Trend Tracking Indexes (TTIs)
Our Trend Tracking Indexes (TTIs) changed only slightly but closed up:
Domestic TTI: +1.50% (last close +1.43%)—Buy signal effective 10/22/2014
International TTI: +1.23% (last close +1.05%)—Buy signal effective 2/13/2015
Disclosure: I am obliged to inform you that I, as well as advisory clients of mine, own some of these listed ETFs. Furthermore, they do not represent a specific investment recommendation for you, they merely show which ETFs from the universe I track are falling within the guidelines specified.
Contact Ulli