
1. Moving the Markets
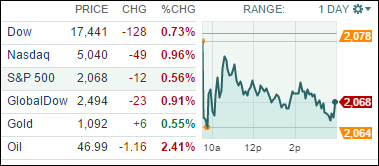
Blame it one the Chinese. With the Shanghai index tanking some 8.5% in today, there was simply no other way to go but down. European stocks took the clue, and the German DAX dropped 2.6%. Following the leaders, the bears quickly took the upper hand in the U.S. markets and down we went, although in far more moderate fashion with the S&P surrendering 0.56% but still staying above the level we finished the month of June.
China’s situation is cause for concern since a lot of international companies rely on that huge market to sell their products. Any weakening demand will affect the future earnings picture here in the U.S. This morning’s report that industrial profits in China fell in June followed Friday’s data showing a private manufacturing index declining to a 15-month low; both are signs that growth appears to stall.
Again, there were no winners today, with the exception of the Select Dividend ETF (DVY), which actually gained 0.09% in the face of adversity. Still, it’s the loser of the year with some -4%. Leading the downside were the Financials (IYF) with -0.78%.
2. ETFs in the Spotlight
In case you missed the announcement and description of this section, you can read it here again.
It features 10 broadly diversified ETFs from my HighVolume list as posted every Monday. Furthermore, they are screened for the lowest MaxDD% number meaning they have been showing better resistance to temporary sell offs than all others over the past year.
Here are the 10 candidates:
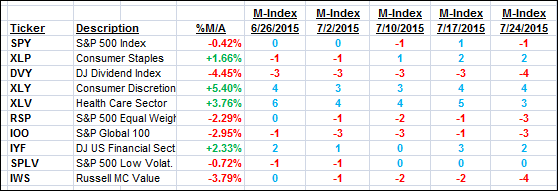
The above table simply demonstrates the magnitude with which some of the ETFs are fluctuating in regards to their positions above or below their respective individual trend lines (%M/A). A break below, represented by a negative number, shows weakness, while a break above, represented by a positive percentage, shows strength.
For hundreds of ETF/Mutual fund choices, be sure to reference Thursday’s StatSheet.
Year to date, here’s how the above candidates have fared so far:
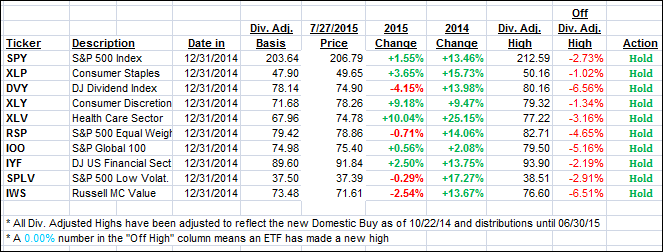
Again, the first table above shows the position of the various ETFs in relation to their respective long term trend lines (%M/A), while the second one tracks their trailing sell stops in the “Off High” column. The “Action” column will signal a “Sell” once the -7.5% point has been taken out in the “Off High” column.
3. Trend Tracking Indexes (TTIs)
Our Trend Tracking Indexes (TTIs) retreated with the International one inching below its long term trendline by a tiny margin; not enough to call this bull market to be over. I will wait and see if this trend line gets pierced further and prices remain below before changing my stance from bullish to bearish.
Here are the closing numbers:
Domestic TTI: +0.54% (last close +0.80%)—Buy signal effective 10/22/2014
International TTI: -0.09% (last close +0.63%)—Buy signal effective 2/13/2015
Disclosure: I am obliged to inform you that I, as well as advisory clients of mine, own some of these listed ETFs. Furthermore, they do not represent a specific investment recommendation for you, they merely show which ETFs from the universe I track are falling within the guidelines specified.
Contact Ulli