Stocks Bounce Back As Oil Rallies

Ulli Market Commentary Contact

Tue pic

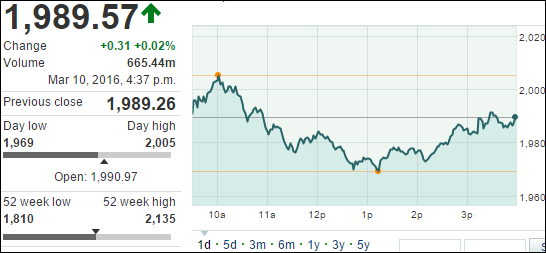
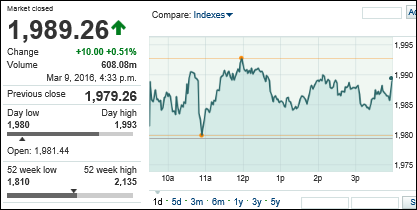
[Chart courtesy of MarketWatch.com]

1. Moving the Markets

Stocks skyrocketed as traders remain hopeful that a year-end ‘Santa Claus rally’ will finally push the major indexes back into positive territory for the year and avoid Wall Street’s first down year since 2008. Investors remain cautious though, as the so-called rally from Saint Nick, may not have yet completely taken flight.

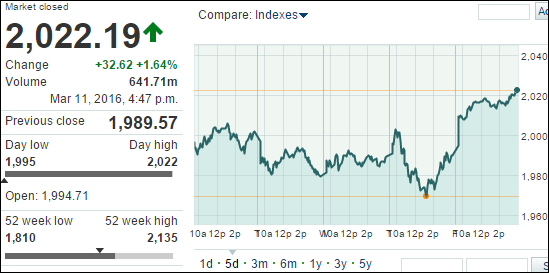
Of course, as we’ve seen in the recent past, equities are tied to the fortunes of oil, which rallied today and pulled the indexes higher. Not much has been gained over the past 2 months despite the S&P closing at 2078 today, which is still 2 points below the price it ended November and 1 point below the price we closed at in October. In other words, the market is just making up previous losses.

Nevertheless, Wall Street is hoping that a year-end rally holds, because if it doesn’t, there’s a good chance that both the Dow and S&P 500 could suffer their first calendar year decline since 2008 when stocks fell more than 30%.

We heard some positive news in the housing market today for investors, but maybe not for future home buyers. U.S. home prices rose 5.2% in October, compared to a year earlier. The housing market appears to be maintaining momentum, according to a key benchmark released Tuesday. The major markets that stood out on rising prices were Denver, Portland and San Francisco. At the bottom of the totem pole was Chicago, Washington D.C. and Cleveland.

And finally, energy stocks bounced back today, led by Chesapeake Energy Corp (CHK) and Consol Energy Inc (CNX).

All of our 10 ETFs in the Spotlight joined the party, with the leader being Healthcare (XLV) with +1.22%, while the Select Dividend ETF (DVY) lagged with +0.61%.

Read More

Markets Fail To Impress; Bulls Still Hoping For ‘Santa Claus Rally’ To End The Year

Ulli Market Commentary Contact

Mon pic

[Chart courtesy of MarketWatch.com]

1. Moving the Markets

Stocks fell and oil prices took a tumble Monday, as the S&P 500 index kicked off the final week of the year by slipping back into the red in a volatile year that has made it tough for U.S. stocks to make much headway. Energy stocks led the declines as the recent uptick in oil prices also faltered. U.S. benchmark crude fell 3.3% to $36.85 a barrel.

We heard some positive news on the economic front today though. Holiday shoppers spent 7.9% more this year than they did in 2014, but they were expected to gravitate more toward online sellers, and brick-and-mortar retailers could feel the impact once the final numbers come out in early 2016.

As I said, it has been a challenging year for U.S. stocks. Domestic equities have been hurt by questions regarding the timing of the Federal Reserve’s first interest rate hike in nearly a decade (the Fed did in fact raise rates a quarter-point in mid-December), plunging oil prices, the negative impact of a strong dollar on sales and earnings of U.S. multinationals, and fears related to the slowdown in China’s economy, which is the world’s second-largest.

Wall Street is still hoping that the normal late-year rally, dubbed the Santa Claus Rally, will kick in this week. This time of year has historically been a seasonally strong period for stocks, as the market benefits from holiday-infused optimism and the benefit of a fresh influx of cash into the stock market as Americans put year-end bonuses to work.

2 of our 10 ETFs in the Spotlight managed to inch higher, led by the Low Volatility ETF (SPLV) with +0.31%. On the downside, we had a tie as Healthcare (XLV) and the Equal Weight S&P (RSP) each gave back -0.47%.

Read More

ETFs/Mutual Funds On The Cutline – Updated Through 12/24/2015

Ulli ETFs on the Cutline Contact

Below are the latest ETF Cutline reports, which show how far above or below their respective long-term trend lines (39 week SMA) my currently tracked ETFs/MFs are positioned.

The first report covers the ETF Master List from Thursday’s StatSheet and includes 381 ETFs, of which currently 55 (last week 35) are hovering in bullish territory.

The second report includes only High Volume ETFs. To clarify, High Volume (HV) ETFs are defined as those with an average daily volume of $10 million or higher. Volume figures can change in a hurry, so be sure to check first before investing.

These ETFs are generated from my selected list of 98 that I use in my advisor practice. It cuts out the “noise,” which simply means it eliminates those ETFs that I would never buy because of their volume limitations. 12 ETFs (last week 10) have managed to remain in bullish territory after the recent market volatility.

The third report covers Mutual Funds on the Cutline. There are currently 83 (last week 48) above the line and 717 below it out of the 800 that I follow.

Take a look:

  1. ETF Master Cutline Report
  2. ETF High Volume Cutline Report
  3. MF Cutline Report

In case you are not familiar with some of the terminology used in the reports, please read the Glossary of Terms.

If you missed the original post about the Cutline approach, you can read it here.

One Man’s Opinion: Will The S&P 500 Provide High Single-Digit To Low Double-Digit Returns In 2016?

Ulli Market Review Contact

Man

The Central Bank continues to dominate the economy of not just the US but globally, said Eric Wiegand, portfolio manager at US Bank. (There has been) a break from the trajectory that was witnessed previously; at least the US has the certainty of one rate-hike behind it.

The debate over the number of increases as the economy moves through 2016 is still out there, and the overall impact on currencies in the level of growth that the economy is likely to see in 2016 is still a question mark, he observed.

Asked if investors should focus on value or growth stocks, Eric said there should be an appropriate mix of the two, to be candid. For US Bank, there are certain sectors that offer better opportunities than others including technology, healthcare – a sector for all seasons, select consumer discretionary stocks, financials as well as industrials, he noted.

Read More

New ETFs On The Block: SPDR S&P 500 High Dividend ETF (SPYD)

Ulli Dividend ETFs Contact

CandleStickChartState Street Global Advisors (SSgA), a unit of State Street and the asset manager behind the iconic SPDR S&P 500 ETF (SPY), recently launched an equity fund dedicated to tracking the performance of the biggest dividend paying stocks listed in the US.

The newly minted SPDR S&P 500 High Dividend ETF (SPYD) targets the top dividend payers in the S&P 500 benchmark and aims to reflect the performance of the S&P 500 High Dividend Index, a gauge consisting of the top 80 dividend yield securities from the S&P 500 Index.

Needless to say, by its very nature, the new fund is comprised of large-cap securities from the US with a weighted-average market cap exceeding $40 billion. To begin with, the underlying index calculates the dividend yields for all the constituents of the S&P 500 Index. To that end, latest dividend payouts, excluding any special/one-time payments, are recorded and are multiplied by the frequency of payouts made in year. The dividend yield is calculated next by dividing annualized dividends by the firm’s current stock price.

Read More