
1. Moving the Markets
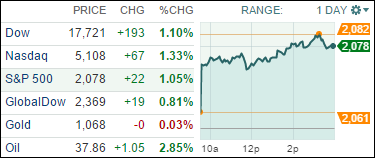
Stocks skyrocketed as traders remain hopeful that a year-end ‘Santa Claus rally’ will finally push the major indexes back into positive territory for the year and avoid Wall Street’s first down year since 2008. Investors remain cautious though, as the so-called rally from Saint Nick, may not have yet completely taken flight.
Of course, as we’ve seen in the recent past, equities are tied to the fortunes of oil, which rallied today and pulled the indexes higher. Not much has been gained over the past 2 months despite the S&P closing at 2078 today, which is still 2 points below the price it ended November and 1 point below the price we closed at in October. In other words, the market is just making up previous losses.
Nevertheless, Wall Street is hoping that a year-end rally holds, because if it doesn’t, there’s a good chance that both the Dow and S&P 500 could suffer their first calendar year decline since 2008 when stocks fell more than 30%.
We heard some positive news in the housing market today for investors, but maybe not for future home buyers. U.S. home prices rose 5.2% in October, compared to a year earlier. The housing market appears to be maintaining momentum, according to a key benchmark released Tuesday. The major markets that stood out on rising prices were Denver, Portland and San Francisco. At the bottom of the totem pole was Chicago, Washington D.C. and Cleveland.
And finally, energy stocks bounced back today, led by Chesapeake Energy Corp (CHK) and Consol Energy Inc (CNX).
All of our 10 ETFs in the Spotlight joined the party, with the leader being Healthcare (XLV) with +1.22%, while the Select Dividend ETF (DVY) lagged with +0.61%.
2. ETFs in the Spotlight
In case you missed the announcement and description of this section, you can read it here again.
It features 10 broadly diversified ETFs from my HighVolume list as posted every Monday. Furthermore, they are screened for the lowest MaxDD% number meaning they have been showing better resistance to temporary sell offs than all others over the past year.
Here are the 10 candidates:
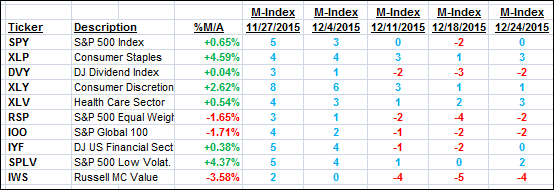
The above table simply demonstrates the magnitude with which some of the ETFs are fluctuating in regards to their positions above or below their respective individual trend lines (%M/A). A break below, represented by a negative number, shows weakness, while a break above, represented by a positive percentage, shows strength.
For hundreds of ETF/Mutual fund choices, be sure to reference Thursday’s StatSheet.
Year to date, here’s how the above candidates have fared so far:
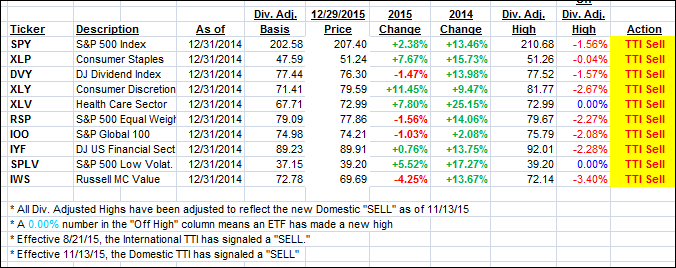
Again, the first table above shows the position of the various ETFs in relation to their respective long term trend lines (%M/A), while the second one tracks their trailing sell stops in the “Off High” column. The “Action” column will signal a “Sell” once the -7.5% point has been taken out in the “Off High” column.
3. Trend Tracking Indexes (TTIs)
Our Domestic Trend Tracking Index (TTI) improved but closed just below its long term trend line. Again, I want to see a clear piercing to the upside along with some staying power before issuing a new Buy signal.
Here’s how we ended up:
Domestic TTI: -0.02% (last close -0.40%)—Sell signal effective 11/13/2015
International TTI: -3.20% (last close -4.08%)—Sell signal effective 8/21/2015
Disclosure: I am obliged to inform you that I, as well as advisory clients of mine, own some of these listed ETFs. Furthermore, they do not represent a specific investment recommendation for you, they merely show which ETFs from the universe I track are falling within the guidelines specified.
Contact Ulli