Momentum Slows But Major Indexes Inch Higher

Ulli Uncategorized Contact

Mon pic

[Chart courtesy of MarketWatch.com]

1. Moving the Markets

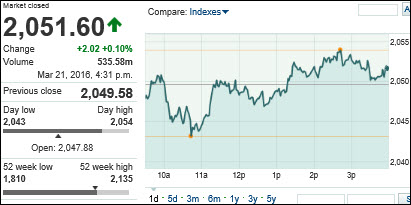
The resurgent U.S. stock market kicked off the holiday-shortened week by slightly extending last week’s gains as investors digested a big rally that has turned stocks positive for the year and reacted to deals in the hotel, paint and data businesses.

A flurry of M&A deals announced Monday gave an assist, including Starwood Hotels & Resorts Worldwide (HOT) agreeing to a better revised deal of $13.6 billion from Marriott International (MAR) that tops a competing bid from China’s Anbang Insurance Group.

Apple (AAPL) was back in the news today. The company unveiled the iPhone SE Monday, which executives described as “the most powerful 4-inch phone ever.” Hitting the market alongside the smaller phone was a trimmed down iPad Pro. The stock moved up and down, but ended at par with the morning.

I for one am very curious to see if the upward momentum of the recent bear market rally can continue as some of the supporting players are no longer in the game. First, most of the shorts have covered so that driving force has been diminished. Second, the biggest contributors to the recent ramp, namely corporate buy-backs, are entering their blackout period, which is the 5 week time frame prior to their quarterly reports cards being issued. Third, according to BofA, most institutional clients, AKA the smart money, took the recent rally as an opportunity to exit the markets or at least lighten up on equity positions.

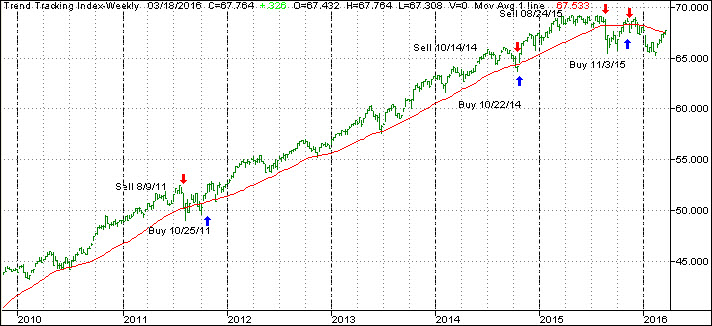
If, however, against this negative backdrop, the markets continue on their upward trajectory, we may very well face a resumption of last year’s bull market, which may possibly coincide with a new Domestic Buy signal. You can see the latest numbers in section 3 below.

Read More

ETFs/Mutual Funds On The Cutline – Updated Through 03/18/2016

Ulli ETFs on the Cutline Contact

Below are the latest ETF Cutline reports, which show how far above or below their respective long-term trend lines (39 week SMA) my currently tracked ETFs/MFs are positioned.

The first report covers the ETF Master List from Thursday’s StatSheet and includes 381 ETFs, of which currently 225 (last week 154) are hovering in bullish territory.

The second report includes only High Volume ETFs. To clarify, High Volume (HV) ETFs are defined as those with an average daily volume of $10 million or higher. Volume figures can change in a hurry, so be sure to check first before investing.

These ETFs are generated from my selected list of 98 that I use in my advisor practice. It cuts out the “noise,” which simply means it eliminates those ETFs that I would never buy because of their volume limitations. 54 ETFs (last week 41) have managed to remain in bullish territory after the recent market volatility.

The third report covers Mutual Funds on the Cutline. There are currently 180 (last week 104) above the line and 600 below it out of the 780 that I follow.

Take a look:

  1. ETF Master Cutline Report
  2. ETF High Volume Cutline Report
  3. MF Cutline Report

In case you are not familiar with some of the terminology used in the reports, please read the Glossary of Terms.

If you missed the original post about the Cutline approach, you can read it here.

One Man’s Opinion: Will First-Quarter Earnings Be Weak Again?

Ulli Market Review Contact

ManThe S&P 500 is pretty close to the year end price target set by JP Morgan, said Steven Rees, Global Head of Equity Strategy at JP Morgan Private Bank. JP Morgan is advising clients to add some protection and to sell some of their exposures, and watch out for dividend strategies.

Since the Fed is going to be hiking slower than expected, dividend strategies can still work now. Investors should look at sectors that have lagged such as consumer discretionary, and consider opportunities outside of the US in places like Europe and Japan, which have actually pulled back more than the US, he noted.

Asked how investors could add protection to their portfolios, Steve said investors could buy some short-term puts as the markets could go down by 5-6 percent from here. JP Morgan doesn’t believe the US would fall into a recession and have been buying in the dips quite aggressively through January and February. Markets are currently valued at 16-½ times earnings and JPM believes that valuation is fair.

Read More

New ETFs On The Block: Cambria Sovereign High Yield Bond ETF (SOVB)

Ulli Bond ETFs, Country ETFs Contact

91551519

With ten-year US Treasury yielding less than two percent, many investors – particularly the baby boomers and the retirees, are thirsty for higher returns from their fixed-income portfolios.

Unfortunately, with many developed economies turning to negative interest rates as a standard monetary policy tool, earning higher compensation for owning sovereign debt is becoming increasingly difficult.

Los Angeles based Cambria Investment Management, managed by alternative investment manager Meben Faber, recently launched its first fixed-income ETF to help meet investors’ craving for higher yields.

Read More

ETF/No Load Fund Tracker Newsletter For March 18, 2016

Ulli ETF Tracker Contact

ETF/No Load Fund Tracker StatSheet

————————————————————-

https://theetfbully.com/2016/03/weekly-statsheet-for-the-etfno-load-fund-tracker-newsletter-updated-through-03172016/

————————————————————

Market Commentary

DOW POSTS SIX DAY STREAK; MARKETS ON A ROLL TO CLOSE THE WEEK

Fri pic 

[Chart courtesy of MarketWatch.com]

1. Moving the Markets

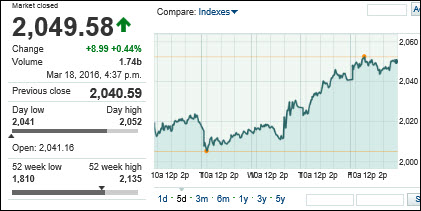
Stocks jumped Friday as Wall Street continued its recent rally with the Dow rising for a sixth straight day as it pushed further into positive territory for the year. The rally also boosted the S&P 500 back into the black for 2016 after briefly turning positive Thursday.

An improvement in oil prices has helped boost financial markets as benchmark U.S. crude jumped above $41 in early trading before pulling back. West Texas intermediate was trading flat at $40.20 a barrel after closing Thursday above $40 for the first time since early December. Oil is now up more than 50% since plunging to a 13-year low of $26.21 on Feb. 11.

Of course, the main driver for this week’s continuation to the upside has been the Fed’s decision not to normalize rates at this time but chose instead to cave in to Wall Street’s desire of an accommodating policy. To my way of thinking this will put the Fed into a tight corner when, not if, the next financial crisis develops and a lowering of rates, such as in 2008, will no longer be a rescue option. If your thinking is that these elevated market levels in no way represent underlying economic fundamentals, you are absolutely correct.

Be that as it may, we’re slowly inching towards a new potential Domestic Buy signal. You can review the exact numbers in section 3 below.

Read More

Weekly StatSheet For The ETF/No Load Fund Tracker Newsletter – Updated Through 03/17/2016

Ulli Market Commentary Contact

ETF/Mutual Fund Data updated through Thursday, March 17, 2016

TOC010716

If you are not familiar with some of the terminology used, please see the Glossary of Terms.


1. DOMESTIC EQUITY MUTUAL FUNDS/ETFs: SELL — since 11/13/2015

TTI

Our main directional indicator, the Domestic Trend Tracking Index (TTI-green line in above chart) has recently crawled above its long term trend line (red) and finally generated a new “Buy” signal effective 11/3/15. The market subsequently dropped, and we exited again on 11/13/15. As of today, the TTI has just crawled above its trend line by +0.29%. This is move is not enough to generate a new Buy signal. Stay tuned for daily updates and any changes to our position.

Read More