
1. Moving the Markets
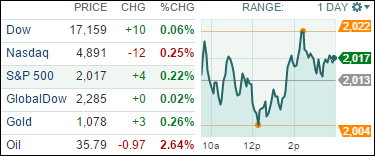
Wall Street entered the second day of trading of 2016 on the defensive as investors still reeled from a global stock sell-off Monday and evaluated the most recent steps taken by Chinese authorities to stabilize markets and reduce jitters.
Overnight, shares in mainland China stabilized with the help once again from government intervention in markets a day after a 7% plunge prompted an early halt to trading in what was the worst start to the year ever for China stocks.
Here in the U.S., we heard some positive news in the auto industry. Automakers posted a solid 9% sales gain in December, an exclamation mark that sealed 2015 as the biggest sales year ever for the industry. Automakers sold 17.47 million vehicles for the year, Autodata reported, besting what Kelley Blue Book reported as the previous record, which was 17.35 million in 2000. Low gas prices, cheap credit, low unemployment, soaring consumer confidence and warm weather fueled a rush into the showroom in December apparently.
And in tech, Investors hoping the Apple (AAPL) stock implosion would end this year are now clinging to what’s left of the triple-digit stock price. Shares of the iPhone maker closed down another 2.5%, or $2.64, Tuesday to $102.71. The once-hot stock is now careering toward the $100-a-share level — a price threshold bulls are hoping will finally hold. Apple’s stock hasn’t closed below $100 since late October 2014.
Our 10 ETFs in the Spotlight were mixed as the market attempted to bounce back with 8 of them closing higher, while 2 of them ended up in the red. Leading the charge to the upside was the Low Volatility ETF (SPLV) with +0.82%. On the downside, Consumer Discretionaries (XLY) gave back a minor -0.13%.
2. ETFs in the Spotlight
In case you missed the announcement and description of this section, you can read it here again.
It features 10 broadly diversified ETFs from my HighVolume list as posted every Monday. Furthermore, they are screened for the lowest MaxDD% number meaning they have been showing better resistance to temporary sell offs than all others over the past year.
Here are the 10 candidates:
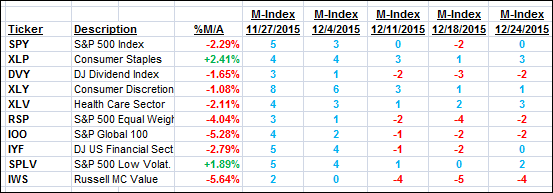
The above table simply demonstrates the magnitude with which some of the ETFs are fluctuating in regards to their positions above or below their respective individual trend lines (%M/A). A break below, represented by a negative number, shows weakness, while a break above, represented by a positive percentage, shows strength.
For hundreds of ETF/Mutual fund choices, be sure to reference Thursday’s StatSheet.
Year to date, here’s how the above candidates have fared so far:
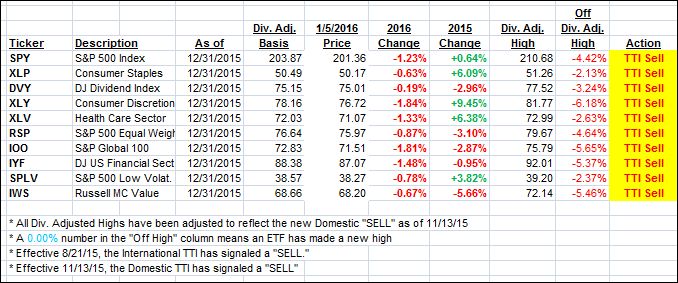
Again, the first table above shows the position of the various ETFs in relation to their respective long term trend lines (%M/A), while the second one tracks their trailing sell stops in the “Off High” column. The “Action” column will signal a “Sell” once the -7.5% point has been taken out in the “Off High” column.
3. Trend Tracking Indexes (TTIs)
Our Domestic Trend Tracking Index (TTI) changed only slightly as the major indexes went nowhere.
Here’s how we ended up:
Domestic TTI: -1.39% (last close -1.42%)—Sell signal effective 11/13/2015
International TTI: -5.96% (last close -5.85%)—Sell signal effective 8/21/2015
Disclosure: I am obliged to inform you that I, as well as advisory clients of mine, own some of these listed ETFs. Furthermore, they do not represent a specific investment recommendation for you, they merely show which ETFs from the universe I track are falling within the guidelines specified.
Contact Ulli