
1. Moving the Markets
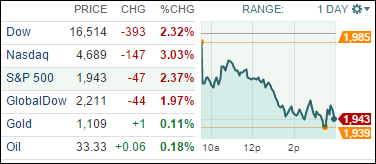
Wall Street’s worst opening to a new year since 2008 got even uglier today when repeated waves of selling sent the Dow tumbling almost 400 points and the Nasdaq into correction territory amid a global stock rout that started when China halted trading in its market again following a 7% plunge.
The real drama was in the tech-heavy Nasdaq Composite, which plunged 3% to 4689.43, leaving it more than 10% below its July record close and officially in correction territory.
China was again the epicenter of the sell-off. Sparking angst was a freefall in Chinese stocks at the start of trading there, which triggered a shutdown of the Chinese stock market about 30 minutes into the trading session. That marks the shortest trading day in the market’s short history. It was the second trading halt this week.
While Wall Street is in turmoil, it seems to me that for the first time in many years, equities appear to slowly move in sync with the actual performance of the economy and not be controlled and manipulated by the great enabler of bull markets, namely the Fed. If you look at most of the data being published ranging from factory orders, imports, exports, industrial production along with the services sector, not just in the U.S. but China as well, you will notice that all have been in a prolonged downturn. So, will tomorrow’s payroll numbers come to the rescue?
All of our 10 ETFs in the Spotlight followed the “down” theme of 2016 and closed lower. The worst performer of the day was the S&P 500 (SPY) with -2.40%; holding up reasonably well was Consumer Staples (XLP) with -1.20%.
We continue to stay on the sidelines with our Domestic TTI now firmly entrenched in bear market territory. See section 3 below for details.
2. ETFs in the Spotlight
In case you missed the announcement and description of this section, you can read it here again.
It features 10 broadly diversified ETFs from my HighVolume list as posted every Monday. Furthermore, they are screened for the lowest MaxDD% number meaning they have been showing better resistance to temporary sell offs than all others over the past year.
Here are the 10 candidates:
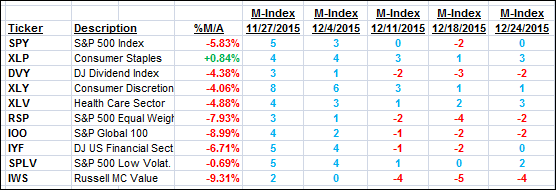
The above table simply demonstrates the magnitude with which some of the ETFs are fluctuating in regards to their positions above or below their respective individual trend lines (%M/A). A break below, represented by a negative number, shows weakness, while a break above, represented by a positive percentage, shows strength.
For hundreds of ETF/Mutual fund choices, be sure to reference Thursday’s StatSheet.
Year to date, here’s how the above candidates have fared so far:
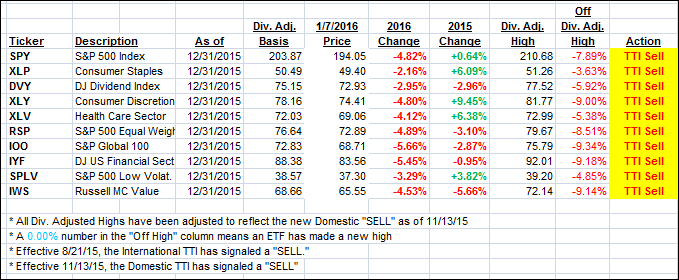
Again, the first table above shows the position of the various ETFs in relation to their respective long term trend lines (%M/A), while the second one tracks their trailing sell stops in the “Off High” column. The “Action” column will signal a “Sell” once the -7.5% point has been taken out in the “Off High” column.
3. Trend Tracking Indexes (TTIs)
Our Domestic Trend Tracking Index (TTI) got clobbered today as downward momentum accelerated confirming that we indeed have moved solidly into bear market territory. Being in cash on the sidelines is the most appropriate course of action during these turbulent times.
Here’s how this day ended:
Domestic TTI: -2.69% (last close -1.81%)—Sell signal effective 11/13/2015
International TTI: -9.07% (last close -7.23%)—Sell signal effective 8/21/2015
Disclosure: I am obliged to inform you that I, as well as advisory clients of mine, own some of these listed ETFs. Furthermore, they do not represent a specific investment recommendation for you, they merely show which ETFs from the universe I track are falling within the guidelines specified.
Contact Ulli