Weekly StatSheet For The ETF/No Load Fund Tracker Newsletter – Updated Through 03/31/2016

Ulli ETF StatSheet Contact

ETF/Mutual Fund Data updated through Thursday, March 31, 2016

TOC010716

If you are not familiar with some of the terminology used, please see the Glossary of Terms.


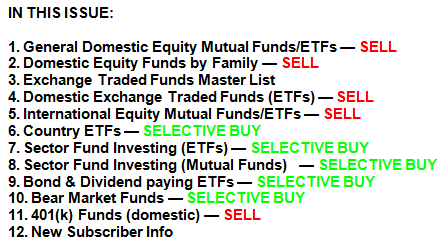
1. DOMESTIC EQUITY MUTUAL FUNDS/ETFs: SELL — since 11/13/2015

TTI-3-31

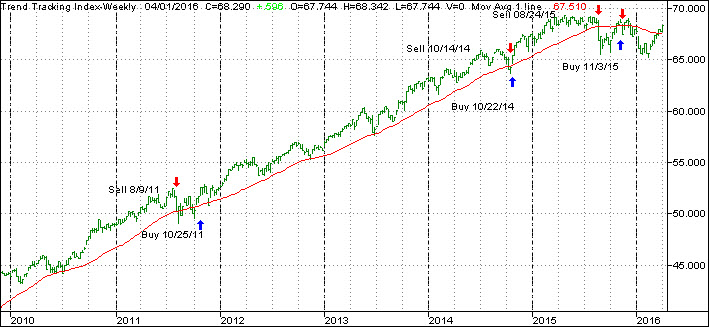
Our main directional indicator, the Domestic Trend Tracking Index (TTI-green line in above chart) has recently crawled above its long term trend line (red) and finally generated a new “Buy” signal effective 11/3/15. The market subsequently dropped, and we exited again on 11/13/15. As of today, the TTI has just moved above its trend line by +0.95%. This is move is not enough to generate a new Buy signal. Stay tuned for daily updates and any changes to our position.

Read More

Waiting For The Jobs Report

Ulli Market Commentary Contact

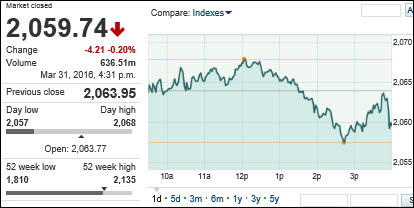
Thur pic

[Chart courtesy of MarketWatch.com]

1. Moving the Markets

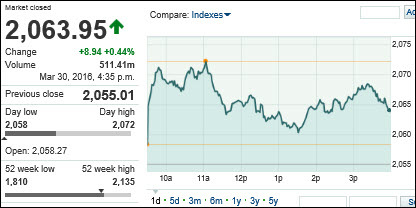
Who would have thought that markets would be in positive territory at the end of March, given the horrendous start to the year. As of the closing bell, the Dow and S&P 500 are officially both in positive territory YTD.

At the pinnacle of fearing Bears may take over, which was around mid-February, all of the major domestic indexes had fallen more than 10% for the year. Today, the S&P 500 is up 1% YTD and with the Dow not far behind. Of course, as MSM media conveniently does not mention, this mysterious recovery did not generate any new profits for those who were in the market, it merely wiped out the losses that occurred during the first six weeks of 2016. As trend followers, we are very well aware of that fact.

Domestic stocks are now riding a 2-day rally wave that Janet Yellen started on Tuesday after reiterating that the nation’s central bank is in no rush to hike interest rates AKA pleasing Wall Street. However, Wall Street is still awaiting economic data to be released tomorrow.

As we discussed on Monday, Friday we will hear about the jobs report for March, which will have an impact on the Fed’s stance regarding the state of the economy and potential interest rate hikes. If the report comes in way below expectations, we could either see a swoon in equities as disappointment reigns supreme or another sharp leg higher, as Wall Street would expect the Fed to start more Quantitative Easing. Which will it be?

We’ll have to wait until tomorrow to find out.

Read More

Follow Through Buying Elevates Indexes—Domestic TTI Closes In On A New “Buy”

Ulli Market Commentary Contact

Wed pic

[Chart courtesy of MarketWatch.com]

1. Moving the Markets

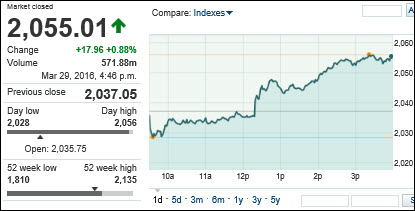
Markets remained strong the day after Janet Yellen stressed that the central bank will remain “cautious” in its approach to raising interest rates. In case you missed it, “cautious” means being accommodative to the financial markets no matter what.

Helping stocks higher today was another decline in the value of the U.S. dollar vs foreign currencies. Remember, a lower dollar helps sales and profits for U.S. multinationals, as well as oil and emerging markets.

Tech geeks’ eyes are waiting for the unveiling of Tesla’s (TSLA) new electric car this Thursday. The ‘Model 3’ will hit the market at a price tag of about $35,000, which will compete with Acura, BMW and other popular luxury brands, but at half the price of its current Model S sedan. The stock remains about at par with its starting price at the beginning of the year.

Oil, which remains at the forefront of market moving commodities, closed where it started, at $38.28 a barrel. Oil prices have risen about 50% over the past 2 months after the OPEC suggested ideas of slowing production. The $40 a barrel benchmark is still what investors are watching, however, the black gold has been on a mini slide closing lower for 6 days in a row.

Our Domestic TTI inched higher again and is now within shouting distance of a new “Buy” signal. Please see section 3 below for more details.

Read More

The Fed Blinks—Markets Rally

Ulli Market Commentary Contact

Tue pic

[Chart courtesy of MarketWatch.com]

1. Moving the Markets

Both the Dow and S&P 500 closed at high water marks for 2016. Movement upward today was driven mostly by Janet Yellen’s speech today in New York wherein she said the central bank will “move cautiously” on interest rate hikes. The “cautious” stance is mostly due to risks of a weak global economy and low inflation. In other words, the promise of interest normalization via 4 small hikes during 2016 went out the window. Imagine a tiny 0.25% hike is considered too much for the economy to handle, which gives you an idea of the true state of affairs.

In the end, we all know by now that economic data points no longer matter, as the Fed alone determines market direction via its dovish or hawkish announcements. Even oil, which has led the S&P higher during most of March, decoupled and lost over 2% on the day while equities rallied.

I mentioned investors will be eyeing economic news this week. Today, we saw data on consumer confidence and home prices. Home prices rose 5.7% YoY. Seattle, San Francisco and Portland led the pack. The consumer confidence index rose 96.2% in March, up from 94 in February.

We heard a bit of shocking news today that SunEdison (SUNE) is flirting with bankruptcy amid questions over the company’s accounting practices and falling oil prices. Shares of the stock tumbled 41% in pre-market trading to 74 cents a share. Analysts say the company’s biggest issue is lack of liquidity.

Stay tuned for the all important employment figures this Friday.

Read More

Quiet Monday After Easter; GM Moves Towards Autopilot

Ulli Market Commentary Contact

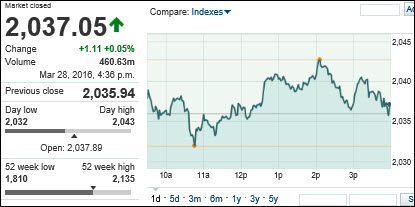
Mon pic

[Chart courtesy of MarketWatch.com]

1. Moving the Markets

The major indexes closed moderately higher after a day with little volatility. Perhaps the hesitance in markets today was the fact that investors are waiting to react to more economic news this week that will provide further insight into the state of the slumping domestic economy.

Today, we received reports on personal income, consumer spending and pending home sales. Personal income data showed a slight 0.2% gain. Consumer spending was in line with expectations and pending home sales rose 3.5%, which topped expectations and signaled that the real estate recovery continues.

On Tuesday, we’ll hear March’s consumer confidence survey, but the big data point comes in on Friday when the government will issue its March jobs report. If the report comes in strong, it could signal a sooner than expected rate hike in April.

In M&A news today, General Motors (GM) received a solid regulatory approval to acquire Cruise Automation, a 3 year old startup company that has developed an autopilot system that GM is drooling over. Cruise has a device that will enable drivers to give complete control of the accelerator, brakes and steering to the car. The purchase price of the company was not reported, but rumors allege that GM paid around $1 billion.

Read More

ETFs/Mutual Funds On The Cutline – Updated Through 03/24/2016

Ulli ETFs on the Cutline Contact

Below are the latest ETF Cutline reports, which show how far above or below their respective long-term trend lines (39 week SMA) my currently tracked ETFs/MFs are positioned.

The first report covers the ETF Master List from Thursday’s StatSheet and includes 381 ETFs, of which currently 176 (last week 225) are hovering in bullish territory.

The second report includes only High Volume ETFs. To clarify, High Volume (HV) ETFs are defined as those with an average daily volume of $10 million or higher. Volume figures can change in a hurry, so be sure to check first before investing.

These ETFs are generated from my selected list of 98 that I use in my advisor practice. It cuts out the “noise,” which simply means it eliminates those ETFs that I would never buy because of their volume limitations. 44 ETFs (last week 54) have managed to remain in bullish territory after the recent market volatility.

The third report covers Mutual Funds on the Cutline. There are currently 125 (last week 180) above the line and 655 below it out of the 780 that I follow.

Take a look:

  1. ETF Master Cutline Report
  2. ETF High Volume Cutline Report
  3. MF Cutline Report

In case you are not familiar with some of the terminology used in the reports, please read the Glossary of Terms.

If you missed the original post about the Cutline approach, you can read it here.