
1. Moving the Markets
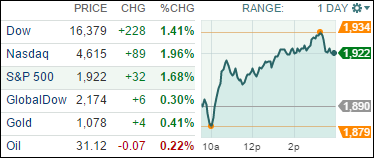
After an early, rough start Thursday, stocks finally shot higher with the Dow jumping more than 300 points before moderating its gains after Wednesday’s brutal sell-off that sent the broad U.S. stock market down more than 10% from its highs. Of course, the indexes were oversold, so a bounce back had to happen sooner or later, but the question remains if this is simply another dead cat bounce or the resumption of the prior bullish trend. Since no one has that answer, we will have to wait and see how it plays out.
In the meantime, Wall Street is gearing up for an onslaught of fourth-quarter 2015 earnings reports in coming weeks. And even though analysts are expecting a second-straight quarter of contracting earnings growth, there is hope that the earning season will ease fears about the U.S. economy amid the current global growth fears.
Before the opening bell, Wall Street got a better-than-expected earnings report from JPMorgan Chase (JPM). The big bank topped both profit and revenue expectations.
Wall Street was also closely watching oil prices again today, which were mostly trading in the black. A barrel of U.S.-produced crude was up 1.67% to close at $31.56. A drop below $30 a barrel earlier this week spooked investors, prompting many Wall Street firms to lower their price projections for crude. A 2% rise in stocks in mainland China’s Shanghai composite index also helped boost sentiment today.
All of our 10 ETFs in the Spotlight joined the rebound party and closed in the green headed by Healthcare (XLV) with +2.68%. Consumer Staples (XLP) was lagging with +0.47%.
2. ETFs in the Spotlight
In case you missed the announcement and description of this section, you can read it here again.
It features 10 broadly diversified ETFs from my HighVolume list as posted every Monday. Furthermore, they are screened for the lowest MaxDD% number meaning they have been showing better resistance to temporary sell offs than all others over the past year.
Here are the 10 candidates:
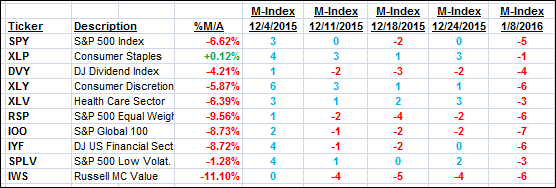
The above table simply demonstrates the magnitude with which some of the ETFs are fluctuating in regards to their positions above or below their respective individual trend lines (%M/A). A break below, represented by a negative number, shows weakness, while a break above, represented by a positive percentage, shows strength.
For hundreds of ETF/Mutual fund choices, be sure to reference Thursday’s StatSheet.
Year to date, here’s how the above candidates have fared so far:
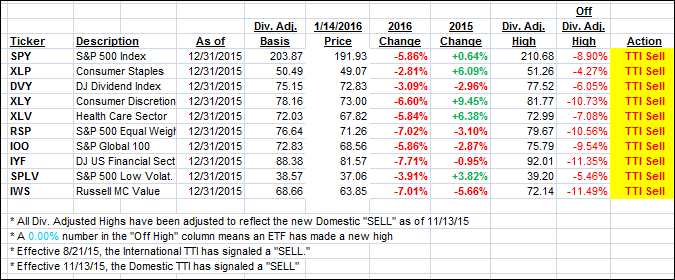
Again, the first table above shows the position of the various ETFs in relation to their respective long term trend lines (%M/A), while the second one tracks their trailing sell stops in the “Off High” column. The “Action” column will signal a “Sell” once the -7.5% point has been taken out in the “Off High” column.
3. Trend Tracking Indexes (TTIs)
Our Domestic Trend Tracking Index (TTI) recovered during today’s bounce back but remains stuck on the bearish side of its respective trend line.
Here’s how we ended up:
Domestic TTI: -3.01% (last close -3.56%)—Sell signal effective 11/13/2015
International TTI: -10.08% (last close -10.91%)—Sell signal effective 8/21/2015
Disclosure: I am obliged to inform you that I, as well as advisory clients of mine, own some of these listed ETFs. Furthermore, they do not represent a specific investment recommendation for you, they merely show which ETFs from the universe I track are falling within the guidelines specified.
Contact Ulli