ETF/No Load Fund Tracker Newsletter For January 22, 2016

Ulli ETF Tracker Contact

ETF/No Load Fund Tracker StatSheet

————————————————————-

THE LINK TO OUR CURRENT ETF/MUTUAL FUND STATSHEET IS:

https://theetfbully.com/2016/01/weekly-statsheet-for-the-etfno-load-fund-tracker-newsletter-updated-through-01212016/

————————————————————

Market Commentary

DIGGING OUT OF A HOLE

Fri pic

[Chart courtesy of MarketWatch.com]

1. Moving the Markets

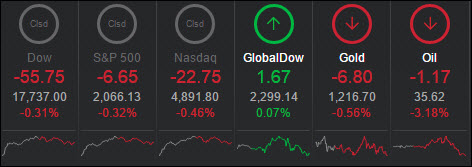
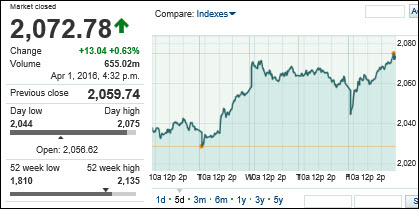
Wall Street stocks scored a second day of gains Friday after a steep sell-off earlier in the week as oil prices bounced sharply higher and investors banked on further stimulus measures from global central banks. Major indexes were higher on the week, with telecom leading advancing sectors and financials the only declining sector. Even after this week-ending rebound, all three U.S. stock indexes remain in correction territory, commonly defined as a drop of 10% or more from recent highs and, of course, confirmed by our Domestic TTI being trapped below its long-term trend line.

Powering Day 2 of the rebound was a big rally in the oil patch, where a barrel of U.S.-produced crude was up more than 8% and back above $32 a barrel. Plunging crude prices, of course, have weighed on stocks this year, as it has raised fears of a coming global slowdown and worries that bankruptcies and upheaval in the oil sector would exacerbate financial tumult.

Economic news was mixed overall for the week, with housing and manufacturing data representing the most significant releases of the week. While the pace of U.S. economic growth appears to have slowed some more recently, it continues to remain on plus side—so far but only barely.

Heading into next week, Wednesday’s Federal Open Market Committee (FOMC) rate decision should be the marquee event of the week. Other major economic reports include the S&P/Case-Shiller home price index and consumer confidence on Tuesday, durable goods orders on Thursday, and fourth-quarter GDP on Friday.

All of our 10 ETFs in the Spotlight joined the 24-hour party and closed up with the Global 100 (IOO) leading the pack with a gain of +2.43%, while Consumer Staples (XLP) lagged but still showed a good performance with +1.71%.

Read More

Weekly StatSheet For The ETF/No Load Fund Tracker Newsletter – Updated Through 01/21/2016

Ulli ETF StatSheet Contact

ETF/Mutual Fund Data updated through Thursday, January 21, 2016

TOC010716

If you are not familiar with some of the terminology used, please see the Glossary of Terms.


1. DOMESTIC EQUITY MUTUAL FUNDS/ETFs: SELL — since 11/13/2015

TTI

Our main directional indicator, the Domestic Trend Tracking Index (TTI-green line in above chart) has recently crawled above its long term trend line (red) and finally generated a new “Buy” signal effective 11/3/15. The market subsequently dropped, and we exited again on 11/13/15. As of today, the TTI remains below its trend line by -3.65%, which means we are in cash on the sidelines.

Read More

Oil & ECB Move Markets Higher

Ulli Market Commentary Contact

Thur pic

[Chart courtesy of MarketWatch.com]

1. Moving the Markets

After Wednesday’s wild ride and sizable stock market reversal that limited losses, Wall Street attempted a rebound Thursday with the Dow rising triple digits after oil jumped 5% and European stocks rallied on ECB stimulus talk.

Wall Street kicked off the session wondering if yesterday’s big drop and late-day comeback was a sign of a short-term selling climax that could finally pave the way for a market bounce back. The general consensus on Wall Street is that, if anything, the market has suffered enough pain since the start of 2016 to at least mount a counter-trend rally. However, fears of a continued selloff do remain rampant, so today may very well have been a dead cat bounce.

Stocks got a boost as the head of the European Central Bank said it will review its monetary policy stance in March. That comment from ECB President Mario Draghi could mean more stimulus is on the way to combat slow growth and worsening inflation in the Eurozone.

Today’s rally was also helped by a rise in oil prices as U.S. benchmark crude jumped about 5% back up to almost $30 a barrel.

8 of our 10 ETFs in the Spotlight ended up in the gree lead by Consumer Discretionaries (XLY) with +1.28%. Closing in the red were Healthcare (XLV) and the Financials (IYF) with -0.30% and -0.17% respectively.

Read More

Tickets On Sale Now For The Wall Street Roller Coaster!

Ulli Market Commentary Contact

Wed pic

[Chart courtesy of MarketWatch.com]

1. Moving the Markets

Wednesday was a wild roller coaster ride on Wall Street, with stocks moving off of earlier, huge losses and the Nasdaq almost landing in positive territory. The sell-off that has engulfed global stock markets early in 2016 intensified from the market open, with the Dow plunging as much as 565 points and oil breaking below $27 a barrel for the first time since 2003.

Sparking Wednesday’s stock sell-off around the world were many of the same worries that have dragged down shares all year: Fears of slowing growth around the globe and the continued plunge in oil at a time when markets are craving stabilization in the oil patch.

The price of West Texas Intermediate, the U.S. crude benchmark, tumbled 6% to $26.76 a barrel, its lowest closing level since May, 2003, according to the Oil Price Information Service. The price of Brent crude, the global benchmark, tumbled 3.2% to $27.10, its lowest closing mark since September, 2003.

In tech news, shares of the gadget maker plunged early Wednesday by as much as 3.4% to $93.42. The decline in Apple knocked the battleground stock near the $92 a share it fell to last August during a market malfunction. This freak-out low is the next big challenge for the shares, as investors wonder how low the stock can go. The low held strong though as the stock closed up 13 cents to $96.79.

Today’s wild ride could have ended far worse than it did, supporting what I have frequently mentioned that huge market drops followed my mind numbing recoveries are typical of bear markets. So, if you napped through my domestic Sell signal of 11/13/2015 you better realize that the bear is still with us and getting stronger—plan accordingly, before your 401k turns into a 201k.

9 of our 10 ETFs in the Spotlight headed south with only one showing some green, namely Healthcare (XLV), which eked out at +0.19% gain. Topping the losers were the Financials (IYF) with -1.92%.

Read More

Equities End Mixed As Crude Oil Slides

Ulli Market Commentary Contact

Tue pic

[Chart courtesy of MarketWatch.com]

1. Moving the Markets

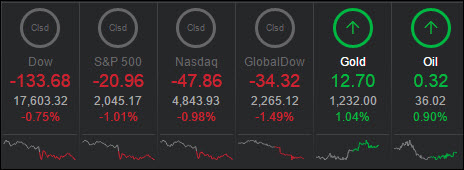
The major U.S. stock indexes kicked off the trading week in a mixed fashion. U.S. stocks, still reeling from its worst yearly start ever, were able to close mostly higher in a bumpy trading session as traders shook off fears after China’s 2015 economic growth hit its lowest level in 25 years, but was not as bad as feared. GDP growth for 2015 in China came in at 6.9%, which is the lowest growth rate since 1990.

Keeping gains in check was another sharp drop in the price of U.S.-produced crude, which was off $1.03, or 3.5%, to close at $28.37 a barrel.

Some earnings reports from big players came in today. Better than expected earnings from Bank of America (BAC) and Morgan Stanley (MS) lifted investor spirits for the moment. So did Netflix (NFLX). The online streaming giant posted 4th quarter earnings that surpassed expectations, mostly due to new international subscribers.

The market is in dire need of a positive earnings season to get some upward momentum restored. On the other hand, the S&P 500 dipped again below its crucial support level of 1,867 today, although it did so only on an intra-day basis. Any close below that point, might invite more selling bringing in the 1,800 level in a hurry. If you are still bullish, you better hope for some blowout earnings to stem the bearish tide.

6 of our 10 ETFs in the Spotlight edged higher during this mixed session with most indexes going sideways. Heading the leaders was Consumer Staples (XLP) with +1.20% while on the downside the Mid-Cap Value ETF (IWS) gave back -0.67%.

Read More

ETFs/Mutual Funds On The Cutline – Updated Through 01/15/2016

Ulli ETFs on the Cutline Contact

Below are the latest ETF Cutline reports, which show how far above or below their respective long-term trend lines (39 week SMA) my currently tracked ETFs/MFs are positioned.

The first report covers the ETF Master List from Thursday’s StatSheet and includes 381 ETFs, of which currently 16 (last week 18) are hovering in bullish territory.

The second report includes only High Volume ETFs. To clarify, High Volume (HV) ETFs are defined as those with an average daily volume of $10 million or higher. Volume figures can change in a hurry, so be sure to check first before investing.

These ETFs are generated from my selected list of 98 that I use in my advisor practice. It cuts out the “noise,” which simply means it eliminates those ETFs that I would never buy because of their volume limitations. 6 ETFs (last week 6) have managed to remain in bullish territory after the recent market volatility.

The third report covers Mutual Funds on the Cutline. There are currently 14 (last week 13) above the line and 767 below it out of the 781 that I follow.

Take a look:

  1. ETF Master Cutline Report
  2. ETF High Volume Cutline Report
  3. MF Cutline Report

In case you are not familiar with some of the terminology used in the reports, please read the Glossary of Terms.

If you missed the original post about the Cutline approach, you can read it here.