ETFs On The Cutline – Updated Through 08/12/2016

Ulli ETFs on the Cutline Contact

Below please find the latest High Volume ETF Cutline report, which shows how far above or below their respective long-term trend lines (39 week SMA) my currently tracked ETFs are positioned.

This report covers the HV ETF Master List from Thursday’s StatSheet and includes 366 High Volume ETFs ETFs, defined as those with an average daily volume >$5 million, of which currently 325 (last week 313) are hovering in bullish territory. The yellow line separates those ETFs that are positioned above their trend line from those that have dropped below it.

Take a look:

The HV ETF Master Cutline Report  

In case you are not familiar with some of the terminology used in the reports, please read the Glossary of Terms.

If you missed the original post about the Cutline approach, you can read it here.

ETF Tracker Newsletter For August 12, 2016

Ulli Market Commentary Contact

ETF Tracker StatSheet

————————————————————-

https://theetfbully.com/2016/08/weekly-statsheet-for-the-etf-tracker-newsletter-updated-through-08112016/

————————————————————

Market Commentary

POOR ECONOMIC DATA EQUALS HIGHER STOCK PRICES

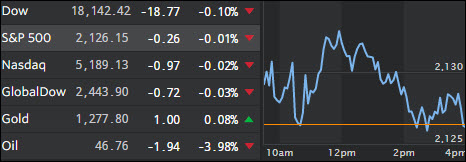
Fri pic

[Chart courtesy of MarketWatch.com]

1. Moving the Markets

If you have been listening to the Main Stream Media (MSM) reporting on the major indexes making one new lifetime high after another over the past month, you might feel like you have been left behind if you decided not to participate in this alleged monstrous breakout into record territory.

Well, don’t feel bad, since much of the hype was just that. Things look different if you review the actual numbers, such as the fact that the S&P 500 only gained a meager +0.4% in the last 3 weeks and +1% in the past 4 weeks. Not exactly a reason for you to feel like you missed out on the rally of a lifetime.

This week turned out to be among the worst in 18 months for economic data as ZH explained succinctly:

Productivity plunges… Retail Sales disappoints… Consumer’s Confidence in their finances lowest since 2014… Weak China data… global bond yields at record lows… US yield curve back near cycle flats… US and Global GDP expectations at cycle lows… BUT best week in oil in 4 months… simultaneous record highs in S&P, Dow, Nasdaq for first time since Dec 31 1999…

Nasdaq is now up 7 weeks in a row – the longest streak since March 2012 – after which it tumbled 13%…

And, US 2016 GDP growth expectations crashed to cycle lows today, as the following chart demonstrates:

Read More

Weekly StatSheet For The ETF Tracker Newsletter – Updated Through 08/11/2016

Ulli ETF StatSheet Contact

ETF Data updated through Thursday, August 11, 2016

TOC081116

Methodology/Use of this StatSheet:

  1. From the universe of over 1,800 ETFs, I have selected only those with a trading volume of over $5 million per day (HV ETFs), so that liquidity and a small bid/ask spread are assured.
  2. Trend Tracking Indexes (TTIs)

Buy or Sell decisions for Domestic and International ETFs (section 1 and 2), are made based on the respective TTI and its position either above or below its long-term M/A (Moving Average). A crossing of the trend line from below accompanied by some staying power above constitutes a “Buy” signal. Conversely, a clear break below the line constitutes a “Sell” signal. Additionally, I use a 7.5% trailing stop loss on all positions in these categories to control downside risk.

  1. All other investment arenas do not have a TTI and should be traded based on the position of the individual ETF relative to its own respective trend line (%M/A). That’s why those signals are referred to as a “Selective Buy.” In other words, if an ETF crosses its own trendline to the upside, a “Buy” signal is generated. Since these areas tend to be more volatile, I recommend a wider trailing sell stop of 7.5% -10% depending on your risk tolerance.

If you are unfamiliar with some of the terminology, please see Glossary of Terms and new subscriber information in section 9.


1. DOMESTIC EQUITY ETFs: BUY — since 4/4/2016

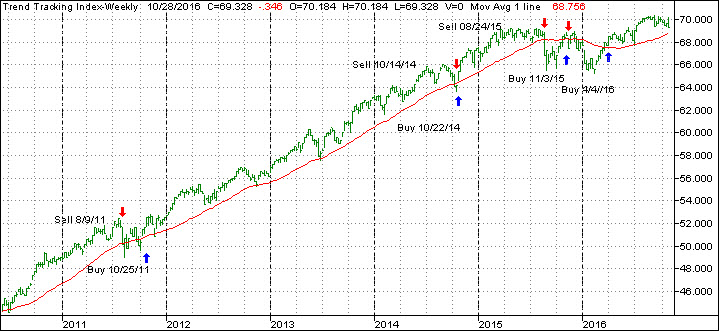
TTI

Our main directional indicator, the Domestic Trend Tracking Index (TTI-green line in the above chart) remains above its long-term trend line (red) by +3.17% after having generated a new Domestic Buy signal effective 4/4/2016 as posted.

Read More

Oil Rallies Sharply And Pulls Indexes Higher

Ulli Market Commentary Contact

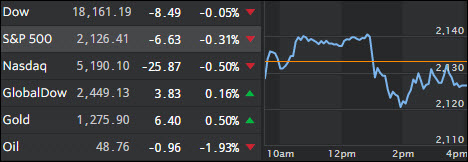
Thur pic

[Chart courtesy of MarketWatch.com]

1. Moving the Markets

It was a glorious day for the markets here in the U.S. Thursday. All three major indexes closed at new record highs, bolstered by department store Macy’s beating of sharply reduced expectations and their closing of 100 stores.

The labor market allegedly remains solid and, after being a drag on the market yesterday, oil prices went the other way for no reason other than empty jaw boning by the Saudis. It is the first time all three major market gauges have set new closing marks on the same day since 1999. Thus, a rare occasion needless to say, but we remember what happened after 1999…

Headline retail earnings were the major market mover today. Shares of Macy’s (M) soared more than 18% after the department store retailer posted better-than-expected quarterly profit and sales and said it plans to close 100 stories, or about 15% of its total stores. Kohl’s (KSS) also topped profit forecasts, giving its shares a 17% bump to the upside. Other notable gainers in retail earlier this week were Nordstrom (JWM) and Ralph Lauren (RL).

In economic news, the Labor Department reported that the number of Americans filing for first-time jobless claims fell 1,000 to 266,000, which is supposed to point to healthy labor market conditions.

Read More

Sliding Crude Oil Puts Equities On Slippery Slope

Ulli Market Commentary Contact

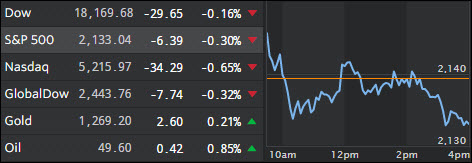
Wed pic

[Chart courtesy of MarketWatch.com]

1. Moving the Markets

A combination of mixed earnings results and sliding crude prices along with a pullback in the US dollar pulled the major indexes off their lofty levels. Other domestic news contributing to this slippery day were fewer than expected job openings, while gold bucked the trend and rose modestly along with bonds.

As has been the case lately, volume has been atrocious making it questionable whether there is enough upside momentum left to continue towards record highs, especially when considering the lack of world-wide growth, weak corporate earnings and general concerns about the domestic economy.

However, not to worry, with the right combination of seducing headlines designed to trigger the computer algos into action, and some soothing words by the Fed about continued lower interest rates, we should be able to reach the S&P 500 2,200 level in no time, unless some sense of reality sets in all of a sudden with some analysts already having expressed fears that the markets are overvalued by some 30%; a fear which is certainly justified in my opinion.

Read More

Bad News Is Good News Again; Worst Productivity Numbers In 37 Years

Ulli Market Commentary Contact

Tue pic

[Chart courtesy of MarketWatch.com]

1. Moving the Markets

In the face of the worst productivity numbers in some 37 years, the markets did what they do best; rally! Although early enthusiasm gave way to a sell-off, the S&P 500 managed to climb back above the unchanged line by a fraction of a percentage after making new intra-day highs. But, investors also wrestled with an earnings miss from retailer Gap.

In earnings news, The Walt Disney Co (DIS) the media giant that owns ESPN and ABC, said its fiscal third quarter net income rose 5% on the strength of its theme park resorts and a hefty revenue gain in the movie production business.

In retail earnings, shares of Gap (GPS) were down 6.2% after the retailer reported disappointing July sales for both its Gap and Banana Republic brands. Shares of high-end retailer Coach (COH) were trading 1.8% lower as investors reacted to earnings that on the surface topped expectations.

Job listings site Monster Worldwide said that it had agreed to sell itself for $429 million, including the assumption of debt, to Netherlands-based global recruiter Randstad Holding.

As you know, I like looking at charts to get a better view as to where the major indexes are compared to underlying economic realities, because eventually we will correct to fair value again—it’s just a matter of time.

Here are 3 charts, courtesy of ZH that clearly demonstrate the lone position the S&P 500 holds in nosebleed territory:

Read More