
1. Moving the Markets
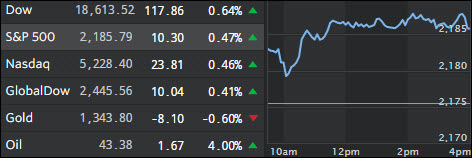
It was a glorious day for the markets here in the U.S. Thursday. All three major indexes closed at new record highs, bolstered by department store Macy’s beating of sharply reduced expectations and their closing of 100 stores.
The labor market allegedly remains solid and, after being a drag on the market yesterday, oil prices went the other way for no reason other than empty jaw boning by the Saudis. It is the first time all three major market gauges have set new closing marks on the same day since 1999. Thus, a rare occasion needless to say, but we remember what happened after 1999…
Headline retail earnings were the major market mover today. Shares of Macy’s (M) soared more than 18% after the department store retailer posted better-than-expected quarterly profit and sales and said it plans to close 100 stories, or about 15% of its total stores. Kohl’s (KSS) also topped profit forecasts, giving its shares a 17% bump to the upside. Other notable gainers in retail earlier this week were Nordstrom (JWM) and Ralph Lauren (RL).
In economic news, the Labor Department reported that the number of Americans filing for first-time jobless claims fell 1,000 to 266,000, which is supposed to point to healthy labor market conditions.
2. ETFs in the Spotlight
In case you missed the announcement and description of this section, you can read it here again.
It features 10 broadly diversified ETFs from my HighVolume list as posted every Monday. Furthermore, they are screened for the lowest MaxDD% number meaning they have been showing better resistance to temporary sell offs than all others over the past year.
Here are the 10 candidates:
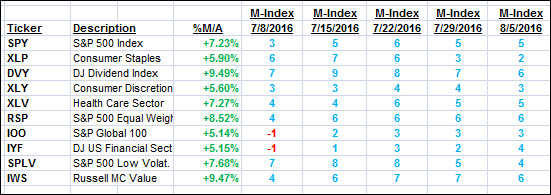
The above table simply demonstrates the magnitude with which some of the ETFs are fluctuating in regards to their positions above or below their respective individual trend lines (%M/A). A break below, represented by a negative number, shows weakness, while a break above, represented by a positive percentage, shows strength.
For hundreds of ETF choices, be sure to reference Thursday’s StatSheet.
Year to date, here’s how the above candidates have fared so far:
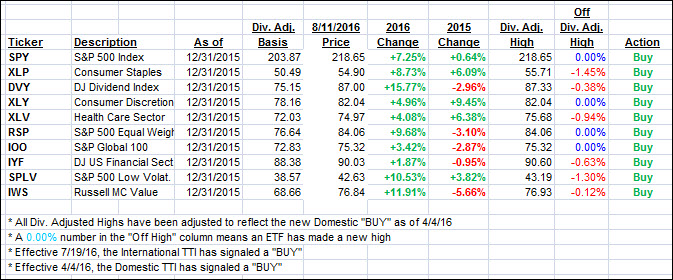
Again, the first table above shows the position of the various ETFs in relation to their respective long term trend lines (%M/A), while the second one tracks their trailing sell stops in the “Off High” column. The “Action” column will signal a “Sell” once the -7.5% point has been taken out in the “Off High” column.
3. Trend Tracking Indexes (TTIs)
Our Trend Tracking Indexes (TTIs) inched higher as oil’s sharp rebound pushed the major indexes into record territory.
Here’s how we ended up on 8/11/2016:
Domestic TTI: +3.17% (last close +3.07%)—Buy signal effective 4/4/2016
International TTI: +4.65% (last close +4.28%)—Buy signal effective 7/19/2016
Disclosure: I am obliged to inform you that I, as well as my advisory clients, own some of the ETFs listed in the above table. Furthermore, they do not represent a specific investment recommendation for you, they merely show which ETFs from the universe I track are falling within the guidelines specified.
Contact Ulli