Stocks Retreat In Directionless Trading

Ulli Market Commentary Contact

Mon pic

[Chart courtesy of MarketWatch.com]

1. Moving the Markets

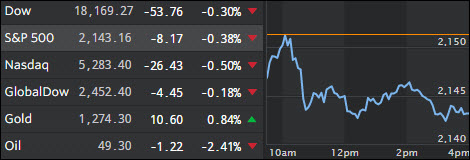
Stocks retreated a bit from last week’s record closes on the heels of an alleged strong jobs report. Equities, which had been stuck in a holding pattern after hitting fresh highs in late July, rallied Friday after the government reported that a better-than-expected 255,000 jobs were created in July. It was the second straight month of employment gains, which reinforced the hope that the U.S. economy and consumers remains alive after a weak start to the year.

In M&A news, we heard that Walmart (WMT) will acquire e-commerce start-up Jet.com in a $3 billion cash deal aimed at helping the world’s largest retailer become an online shopping powerhouse that can take on Amazon.com. Online sales are still just a fraction of Walmart’s overall business, coming in at $13.6 billion last year out of $482 billion in total revenue.

This week’s release of data on June retail sales, a slew of earnings reports from U.S. retailers and the first look at August consumer confidence will be critical to potentially keeping alive a stock rally. Tuesday, we’ll hear from Coach (COH) and Walt Disney (DIS). Wednesday comes apparel maker Ralph Lauren (RL), followed by Macy’s (M) and Nordstrom (JWM). Friday will be the release of July retail sales.

Read More

One Man’s Opinion: A Psychiatric Diagnosis of the U.S. Market: Schizophrenic Disconnect From Reality, Bipolar Mania, Psychotic Delusions of Wealth

Ulli Market Review Contact

By Charles Hugh Smith

Pic1Sun

If you think a delusional market is healthy, it’s time for a psychiatric exam.

What diagnosis would an experienced psychiatrist offer when presented with the bizarre behavior of the U.S. stock market? We assume that the wild mood swings of greed and fear are “normal” for markets devoted to short-term profit and speculation, but the stock market’s disconnect from reality is far beyond mere mood swings.

The stock market thinks it’s solidly on pavement, but in reality it’s like a car flying off a cliff: the Wiley E. Coyote moment is just ahead. There’s nothing but air beneath the stock market.

Consider the reality of PE expansion from a price-earnings (PE) of 10 at the bottom in 2009 to 18+ today, while profits are stagnant. And what is driving this expansion other than a delusional belief that profits will magically reverse and log massive gains in the second half of 2016?

Read More

ETFs On The Cutline – Updated Through 08/05/2016

Ulli ETFs on the Cutline Contact

Below please find the latest High Volume ETF Cutline report, which shows how far above or below their respective long-term trend lines (39 week SMA) my currently tracked ETFs are positioned.

This report covers the HV ETF Master List from Thursday’s StatSheet and includes 367 High Volume ETFs ETFs, defined as those with an average daily volume >$5 million, of which currently 313 are hovering in bullish territory. The yellow line separates those ETFs that are positioned above their trend line from those that have dropped below it.

Take a look:

The HV ETF Master Cutline Report  

In case you are not familiar with some of the terminology used in the reports, please read the Glossary of Terms.

If you missed the original post about the Cutline approach, you can read it here.

ETF Tracker Newsletter For August 5, 2016

Ulli ETF Tracker Contact

ETF Tracker StatSheet

————————————————————-

https://theetfbully.com/2016/08/weekly-statsheet-for-the-etf-tracker-newsletter-updated-through-08042016/

————————————————————

Market Commentary

ALGOS PLAY HEADLINE HOCKEY WITH JOBS NUMBERS

Fri pic

[Chart courtesy of MarketWatch.com]

1. Moving the Markets

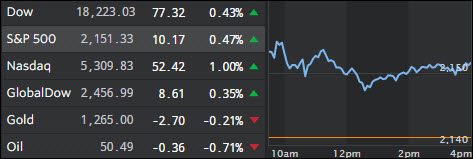
On the surface, the jobs report was awesome as payrolls rose by 255,000 month over month compared to an expected 180,000 gain. June was revised upwards from 287,000 to 292,000 with the total upward revision for May and June being 18,000.

Computer algos had a field day by pushing the indexes higher.

In the end, what it means is that after 2 months of missing expectations, the numbers have “miraculously” come in above forecasts due to seasonal adjustments. One strategist pointed out that today’s jobs report was “nowhere near as strong as the headline and that private payrolls were unadjusted +85k in July vs seasonally adjusted +217k.”

Stock market investing has now been made extremely simple. The S&P 500 climbed into record territory with the help of a better than expected jobs report which, if the numbers are actually correct, has just increased the interest rate hike odds. Simply said, higher interest rates are now good news too, while bad economic numbers are even greater news as it means the Fed will stay pat with the rate hike game. See how logical this all is?

Of course, I am being facetious; the reality is you can’t have it both ways for any length of time, something has to give, i.e. a strengthening economy will cause rates to be hiked at some point, which will cause equities to pull back.

To demonstrate the above that, no matter what, “all” news is good news, ZH featured this incredible chart, which tells it all:

Read More

Weekly StatSheet For The ETF Tracker Newsletter – Updated Through 08/04/2016

Ulli ETF StatSheet Contact

ETF Data updated through Thursday, July 21, 2016

TOC080416

Methodology/Use of this StatSheet:

  1. From the universe of over 1,800 ETFs, I have selected only those with a trading volume of over $5 million per day (HV ETFs), so that liquidity and a small bid/ask spread are assured.
  2. Trend Tracking Indexes (TTIs)

Buy or Sell decisions for Domestic and International ETFs (section 1 and 2), are made based on the respective TTI and its position either above or below its long-term M/A (Moving Average). A crossing of the trend line from below accompanied by some staying power above constitutes a “Buy” signal. Conversely, a clear break below the line constitutes a “Sell” signal. Additionally, I use a 7.5% trailing stop loss on all positions in these categories to control downside risk.

  1. All other investment arenas do not have a TTI and should be traded based on the position of the individual ETF relative to its own respective trend line (%M/A). That’s why those signals are referred to as a “Selective Buy.” In other words, if an ETF crosses its own trendline to the upside, a “Buy” signal is generated. Since these areas tend to be more volatile, I recommend a wider trailing sell stop of 7.5% -10% depending on your risk tolerance.

If you are unfamiliar with some of the terminology, please see Glossary of Terms and new subscriber information in section 9.

 1. DOMESTIC EQUITY ETFs: BUY — since 4/4/2016

TTI

Our main directional indicator, the Domestic Trend Tracking Index (TTI-green line in the above chart) remains above its long-term trend line (red) by +3.04% after having generated a new Domestic Buy signal effective 4/4/2016 as posted.

Read More

Mixed And Choppy

Ulli Market Commentary Contact

Thur pic

[Chart courtesy of MarketWatch.com] 

1. Moving the Markets

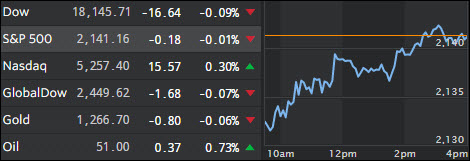
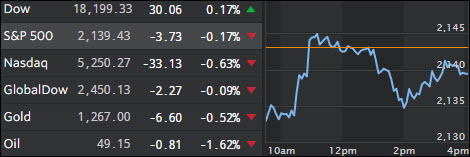
Swinging aimlessly above and below the unchanged line was the theme of the day for the major indexes despite oil shifting into high gear again by gaining 2.3%. There was obvious caution ahead of tomorrow’s Labor report but Treasuries were higher as jobless claims rose while factory orders dropped. Both, the US dollar and gold edged up.

European equities closed up as financials took the lead powered by the Bank of England’s (BoE) benchmark interest rate cut from 0.5% to 0.25%. That, for the time being, put the worries about the ongoing Italian banking crisis on the back burner, but I am sure it will surface again in the not too distant future.

From time to time I feature charts comparing the highly disconnected S&P 500 to underlying realities as presented by real numbers such as GDP, Earnings as measured by GAAP and others. Thanks to ZH, here is another long-term one showing the S&P 500 vs. US factory orders. Take a peek:

Read More