
1. Moving the Markets
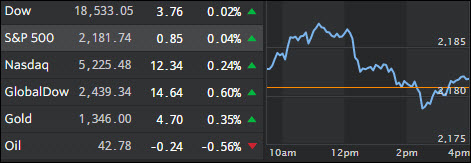
In the face of the worst productivity numbers in some 37 years, the markets did what they do best; rally! Although early enthusiasm gave way to a sell-off, the S&P 500 managed to climb back above the unchanged line by a fraction of a percentage after making new intra-day highs. But, investors also wrestled with an earnings miss from retailer Gap.
In earnings news, The Walt Disney Co (DIS) the media giant that owns ESPN and ABC, said its fiscal third quarter net income rose 5% on the strength of its theme park resorts and a hefty revenue gain in the movie production business.
In retail earnings, shares of Gap (GPS) were down 6.2% after the retailer reported disappointing July sales for both its Gap and Banana Republic brands. Shares of high-end retailer Coach (COH) were trading 1.8% lower as investors reacted to earnings that on the surface topped expectations.
Job listings site Monster Worldwide said that it had agreed to sell itself for $429 million, including the assumption of debt, to Netherlands-based global recruiter Randstad Holding.
As you know, I like looking at charts to get a better view as to where the major indexes are compared to underlying economic realities, because eventually we will correct to fair value again—it’s just a matter of time.
Here are 3 charts, courtesy of ZH that clearly demonstrate the lone position the S&P 500 holds in nosebleed territory:
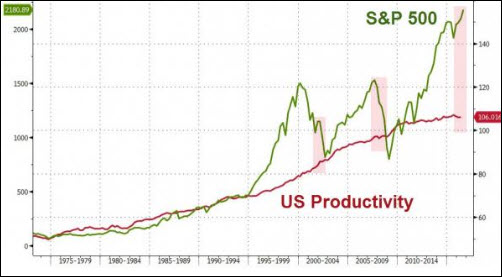
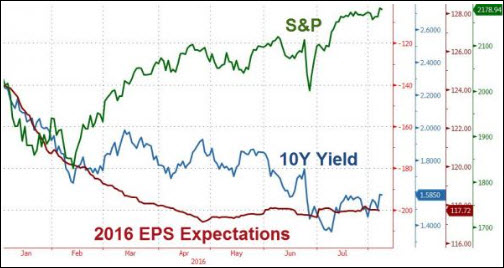
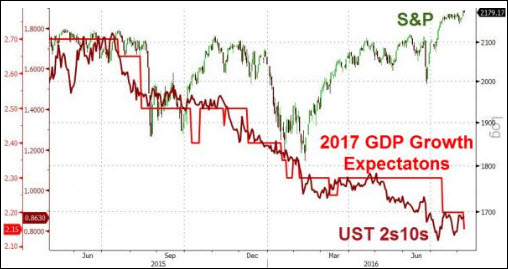
Does this look to you like this unreal S&P positioning can go on forever? Of course not!
However, it’s ok to participate in this rally, but… and that’s a big but… only as long as you have an exit strategy that will limit your losses once momentum wanes and the huge air pocket below comes into play.
2. ETFs in the Spotlight
In case you missed the announcement and description of this section, you can read it here again.
It features 10 broadly diversified ETFs from my HighVolume list as posted every Monday. Furthermore, they are screened for the lowest MaxDD% number meaning they have been showing better resistance to temporary sell offs than all others over the past year.
Here are the 10 candidates:
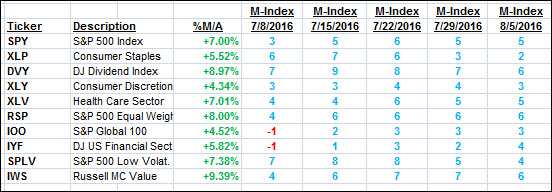
The above table simply demonstrates the magnitude with which some of the ETFs are fluctuating in regards to their positions above or below their respective individual trend lines (%M/A). A break below, represented by a negative number, shows weakness, while a break above, represented by a positive percentage, shows strength.
For hundreds of ETF choices, be sure to reference Thursday’s StatSheet.
Year to date, here’s how the above candidates have fared so far:
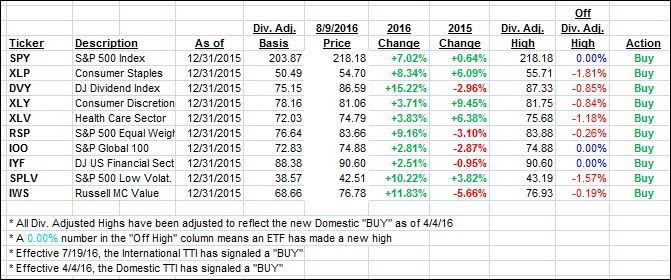
Again, the first table above shows the position of the various ETFs in relation to their respective long term trend lines (%M/A), while the second one tracks their trailing sell stops in the “Off High” column. The “Action” column will signal a “Sell” once the -7.5% point has been taken out in the “Off High” column.
3. Trend Tracking Indexes (TTIs)
Our Trend Tracking Indexes (TTIs) both closed up with the International one stealing the spotlight by showing more upside momentum.
Here’s how we ended up on 8/9/2016:
Domestic TTI: +3.09% (last close +3.02%)—Buy signal effective 4/4/2016
International TTI: +4.18% (last close +3.74%)—Buy signal effective 7/19/2016
Disclosure: I am obliged to inform you that I, as well as my advisory clients, own some of the ETFs listed in the above table. Furthermore, they do not represent a specific investment recommendation for you, they merely show which ETFs from the universe I track are falling within the guidelines specified.
Contact Ulli