ETFs On The Cutline – Updated Through 12/16/2016

Ulli ETFs on the Cutline Contact

Below please find the latest High Volume ETFs Cutline report, which shows how far above or below their respective long-term trend lines (39 week SMA) my currently tracked ETFs are positioned.

This report covers the HV ETF Master List from Thursday’s StatSheet and includes 366 High Volume ETFs ETFs, defined as those with an average daily volume of more than $5 million, of which currently 206 (last week 223) are hovering in bullish territory. The yellow line separates those ETFs that are positioned above their trend line from those that have dropped below it.

Take a look:

The HV ETF Master Cutline Report            

In case you are not familiar with some of the terminology used in the reports, please read the Glossary of Terms.

If you missed the original post about the Cutline approach, you can read it here.

ETF Tracker Newsletter For December 16, 2016

Ulli ETFs on the Cutline Contact

ETF Tracker StatSheet

https://theetfbully.com/2016/12/weekly-statsheet-for-the-etf-tracker-newsletter-updated-through-12152016/

Market Commentary

Coming Off The Pre-Fed Higs
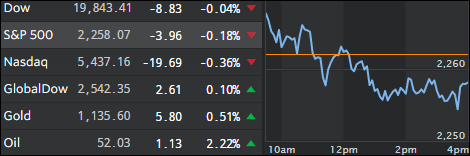
fri-pic

[Chart courtesy of MarketWatch.com]
  1. Moving the Markets

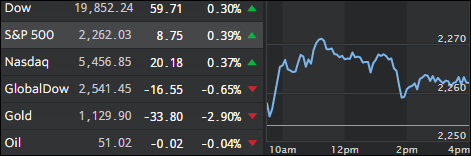
Equities slipped today as upward momentum started to wane after Tuesday’s pre-Fed rally. For the week, the S&P 500 gave back 2 points, which makes it just about an unchanged performance.

Today’s weakness was the result of several events. On the economic side, some geopolitical tensions surfaced as a Chinese Navy warship seized an underwater drone deployed by an American oceanic vessel, which was operating in international waters of the South China Sea.

In the corporate world, Deutsche Bank admitted that it misled investors and violated securities laws and agreed to pay more than $40 million to settle charges. But, of course, as is customary these days, the fine takes the place of any prison term.

On the economic front, housing starts and permits crashed in November 18.7% MoM, almost the biggest monthly plunge since 2005. And just one day after China halted trading in bond futures for the first time ever, today’s news that it failed to sell all T-Bills to be auctioned for the first time in 18 months, indicates that bond traders are concerned that interest rates could spike much higher in the future.

And that could be the canary in the coalmine that will eventually derail the equity markets as I posted yesterday. The key is to watch bond yields which can serve as an early warning sign of things to come in the wide world of stocks. Here’s another chart that makes this abundantly clear:

Read More

Weekly StatSheet For The ETF Tracker Newsletter – Updated Through 12/15/2016

Ulli ETF StatSheet Contact

ETF Data updated through Wednesday, December 15, 2016

TOC082516

Methodology/Use of this StatSheet:

  1. From the universe of over 1,800 ETFs, I have selected only those with a trading volume of over $5 million per day (HV ETFs), so that liquidity and a small bid/ask spread are assured.
  2. Trend Tracking Indexes (TTIs)

Buy or Sell decisions for Domestic and International ETFs (section 1 and 2), are made based on the respective TTI and its position either above or below its long-term M/A (Moving Average). A crossing of the trend line from below accompanied by some staying power above constitutes a “Buy” signal. Conversely, a clear break below the line constitutes a “Sell” signal. Additionally, I use a 7.5% trailing stop loss on all positions in these categories to control downside risk.

  1. All other investment arenas do not have a TTI and should be traded based on the position of the individual ETF relative to its own respective trend line (%M/A). That’s why those signals are referred to as a “Selective Buy.” In other words, if an ETF crosses its own trendline to the upside, a “Buy” signal is generated. Since these areas tend to be more volatile, I recommend a wider trailing sell stop of 7.5% -10% depending on your risk tolerance.

If you are unfamiliar with some of the terminology, please see Glossary of Terms and new subscriber information in section 9.


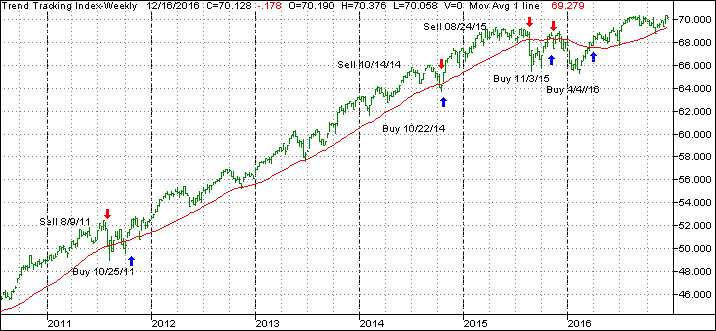
  1. DOMESTIC EQUITY ETFs: BUY — since 4/4/2016

tti

Our main directional indicator, the Domestic Trend Tracking Index (TTI-green line in the above chart) is positioned above its long-term trend line (red) by +1.31% after having generated a new Domestic Buy signal effective 4/4/2016 as posted.

Read More

The Day After: Dip Buyers Pull Indexes Up

Ulli Market Commentary Contact

thur-pic

[Chart courtesy of MarketWatch.com]
  1. Moving the Markets

The major indexes managed to shake off yesterday’s pullback, which marked the day of the Fed’s second hike in interest rates in almost 10 years. While this was widely expected, I thought the markets would have taken that removal of uncertainty as a positive, but Yellen spoiled the party with her announcement that she anticipates three more hikes in 2017. Hmm, 4 rate hikes were promised for 2016 and only “one” materialized…

Interest rates continued to soar with the 10-year Treasury yield now reaching 2.60% from a July 2016 low of 1.37%. That is a huge move and, if we get close to the 3% milestone, there will be some fallout in the stock market as well.

Take a look at the graph below where I have charted the S&P 500 vs. the 10-year Treasury bond:

Read More

Fed Hikes And Market Strikes

Ulli Market Commentary Contact

wed-pic

[Chart courtesy of MarketWatch.com]
  1. Moving the Markets

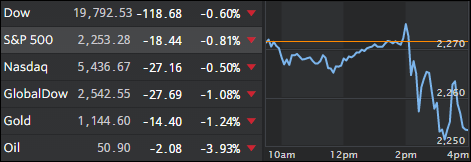
Despite the odds of the Fed hiking rates today having been close to 100%, Wall Street traders went on strike as the post-election bullish momentum waned, and the major indexes sold off by a modest amount which, however, was the worst pull-back in two months.

The Fed finally came through after crying “wolf” all year and hiked interest rates by an expected 0.25% but signaled that future increases could come next year at an increased pace. It’s the latter, I believe, that pulled the rug out from the buying crowd as fiscal assumptions now trend towards slightly faster growth and lower unemployment under a Trump regime.

On the economic front, things don’t seem to indicate any of that faster growth as GDP hopes faded with business inventories dropping worse than expected (-0.2% MoM). Industrial production disappointed big time by declining for the 15th straight month (-0.6% YoY). And to top it off, retail sales growth for November clocked in at a lame 0.1% MoM missing expectations of a 0.3% advance; sales of motor vehicles tumbled 0.5% MoM.

It just goes to show that the “disconnect” between stock market levels and economic fundamentals is alive and well and as wide as ever. Go figure…

Read More

Dow 20,000 Here We Come

Ulli Market Commentary Contact

tue-pic

[Chart courtesy of MarketWatch.com]
  1. Moving the Markets

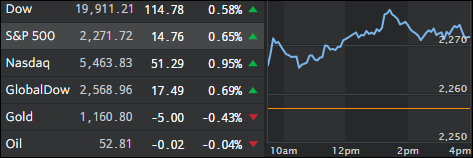
Yesterday’s pause in the market, during which the S&P 500 and the Nasdaq pulled back slightly, formed the basis for more advances today as the Dow reached a point that is within striking distance of the magical 20,000 milestone marker.

All three major indexes stormed into record high territory as the post-election levitation has not shown any signs of a slowdown—so far. Nine of the eleven major S&P sectors advanced with technology being the top dog of the day sporting a gain of +1.23%.

Surely, this parabolic rally will not go on forever as it is based on nothing but hope that Trump and his GOP-controlled congress will enact pro-growth policies. Still, valuations are way out of wack with the S&P 500 trading at an outrageous 17.7 times forward 12-month earnings. This compares to a 10-year median of 14.7 times.

For the time being, the environment remains bullish with all eyes now focused on the Fed’s announcement tomorrow about interest rates. A quarter-point increase has been priced in the markets and, should this materialize, we could see Dow 20,000 by the end of tomorrow’s trading day.

Read More