
1. Moving the Markets
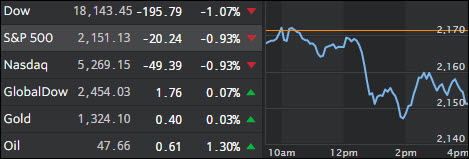
Stocks ended lower today after reports surfaced that some hedge funds were cutting their exposure to Germany’s Deutsche Bank (DB), a move which raised fears that some clients are leery about doing business with the European banking giant. Did a bank run begin? While it’s too early to tell, the denial by DB’s John Cryan about needing more capital and an even more furious denial by ECB’s Draghi that low rates are partly to blame, as well as Chancellor Merkel’s remarks that a government bailout is not in the cards, are sure signs that more trouble is brewing and the pain is spreading.
Some rumors buzzing hint that the swift selloff on Wall Street today signals investor nervousness eight years after the bankruptcy of Wall Street titan Lehman Brothers. If the reports of hedge funds moving money out of Deutsche Bank are true, it may suggest that investors don’t want to put their own cash at risk in the event Deutsche Bank’s problems worsen.
A bit of interesting news on the artificial intelligence front, today, we heard that Amazon (AMZN) is offering $1 million to the university team that builds an artificial intelligence that can keep up its side of the conversation with a human being for 20 minutes. To aid the endeavor, up to ten teams will get a $100,000 stipend from Amazon along with Alexa-enabled devices, free cloud computing and support from Amazon’s Alexa team. Just something to keep an eye on in the future.
2. ETFs in the Spotlight
In case you missed the announcement and description of this section, you can read it here again.
It features 10 broadly diversified ETFs from my HighVolume list as posted every Monday. Furthermore, they are screened for the lowest MaxDD% number meaning they have been showing better resistance to temporary sell offs than all others over the past year.
Here are the 10 candidates:
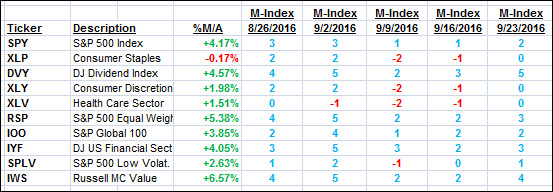
The above table simply demonstrates the magnitude with which some of the ETFs are fluctuating in regards to their positions above or below their respective individual trend lines (%M/A). A break below, represented by a negative number, shows weakness, while a break above, represented by a positive percentage, shows strength.
For hundreds of ETF choices, be sure to reference Thursday’s StatSheet.
Year to date, here’s how the above candidates have fared so far:
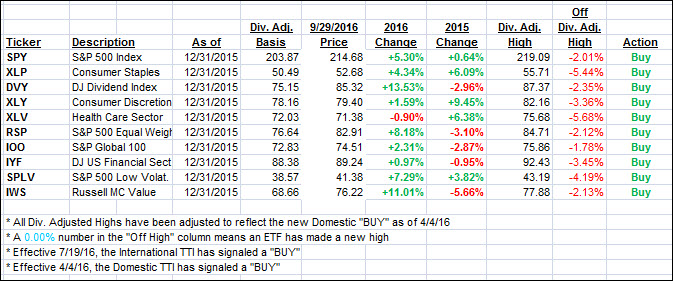
Again, the first table above shows the position of the various ETFs in relation to their respective long term trend lines (%M/A), while the second one tracks their trailing sell stops in the “Off High” column. The “Action” column will signal a “Sell” once the -7.5% point has been taken out in the “Off High” column.
3. Trend Tracking Indexes (TTIs)
Our Trend Tracking Indexes (TTIs) followed the major indexes south as problems with Deutsche Bank drew negative press reports.
Here’s how we closed 9/29/2016:
Domestic TTI: +2.22% (last close +2.65%)—Buy signal effective 4/4/2016
International TTI: +4.35% (last close +5.00%)—Buy signal effective 7/19/2016
Disclosure: I am obliged to inform you that I, as well as my advisory clients, own some of the ETFs listed in the above table. Furthermore, they do not represent a specific investment recommendation for you, they merely show which ETFs from the universe I track are falling within the guidelines specified.
Contact Ulli