Starting The Week On A Mixed Note

Ulli Market Commentary Contact

mon-pic

[Chart courtesy of MarketWatch.com]
  1. Moving the Markets

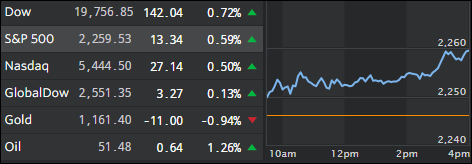
After last week’s rip-roaring run, during which the major indexes scored some solid ground, time for a break was much overdue, especially in view of the Fed’s upcoming meeting on interest rates. The final verdict will be due out on Wednesday with the odds being still close to 100% in favor of a rate hike.

As I’ve commented before, it’s not that the economic environment is justifying an increase in rates; it’s more like the Fed will finally have to deliver after crying wolf all year. At least that’s the consensus. To me it would seem that if the Fed disappoints and holds steady, the markets may stage a sell-off while, on the other hand, if the expected increase occurs, we may see a temporary pick up in the rally as this uncertainty is finally over.

Financials were leading the decliners today, the 10 year US Treasury yield ticked up some 6 basis points to 2.49% from an election reading of 1.8%. Crude oil jumped 1.83% and pushed the energy sector higher, while the US dollar slipped -0.57%.

Read More

One Man’s Opinion: “Investors Are Dangerously Unprepared” – Axel Weber, Former Bundesbank Head Warns Of Coming Rate Hikes By ECB

Ulli Market Review Contact

OneMan'sOpinionSubmitted by Michael Shedlock via MishTalk.com,

Axel Weber, former head of Germany’s central bank says the ECB is going to halt QE soon and hike rates by September.

Weber warns Markets Unprepared for Central Bank Shifts.

Investors are dangerously unprepared for a sharp rise in eurozone bond yields when US interest rates march higher and European quantitative easing ends, Axel Weber, chairman of UBS and the former head of the Bundesbank, has warned.

The jump in US rates could spark big jolts in the markets as the long spell of aggressive monetary easing across the globe has left many investors off-guard over a swing in the global rate cycle, he added.

Read More

ETFs On The Cutline – Updated Through 12/9/2016

Ulli ETFs on the Cutline Contact

Below please find the latest High Volume ETFs Cutline report, which shows how far above or below their respective long-term trend lines (39 week SMA) my currently tracked ETFs are positioned.

This report covers the HV ETF Master List from Thursday’s StatSheet and includes 365 High Volume ETFs ETFs, defined as those with an average daily volume of more than $5 million, of which currently 223 (last week 191) are hovering in bullish territory. The yellow line separates those ETFs that are positioned above their trend line from those that have dropped below it.

Take a look:

The HV ETF Master Cutline Report            

In case you are not familiar with some of the terminology used in the reports, please read the Glossary of Terms.

If you missed the original post about the Cutline approach, you can read it here.

ETF Tracker Newsletter For December 9, 2016

Ulli ETF Tracker Contact

ETF Tracker StatSheet

https://theetfbully.com/2016/12/weekly-statsheet-for-the-etf-tracker-newsletter-updated-through-12082016/

Market Commentary

S&P 500 Logs In Longest Win Streak In 2 Years

fri-pic

[Chart courtesy of MarketWatch.com]
  1. Moving the Markets

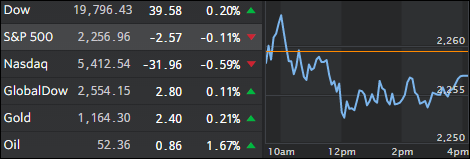
Right now we appear to be on a one-way street as far as the stock market is concerned with the S&P 500 recording its longest win streak since June 2014 while the Dow notched its fifth week of gains.

It appears that Wall Street can’t get enough of the Trump campaign promises of lower taxes, reduced regulations and increased infrastructure investments that are bound to hopefully lead to a new life of economic growth.

Sure, the market surge looks overdone, especially when considering that none of the underlying problems of reckless government spending and ever increasing debt, just to name a couple, are not even being addressed let alone being resolved. Right now, the trend remains our friend, no matter what the underlying fundamentals say, and we will remain on board until our directional indicators give the sign to exit.

Read More

Weekly StatSheet For The ETF Tracker Newsletter – Updated Through 12/08/2016

Ulli ETF StatSheet Contact

ETF Data updated through Wednesday, December 8, 2016

TOC082516

Methodology/Use of this StatSheet:

  1. From the universe of over 1,800 ETFs, I have selected only those with a trading volume of over $5 million per day (HV ETFs), so that liquidity and a small bid/ask spread are assured.
  2. Trend Tracking Indexes (TTIs)

Buy or Sell decisions for Domestic and International ETFs (section 1 and 2), are made based on the respective TTI and its position either above or below its long-term M/A (Moving Average). A crossing of the trend line from below accompanied by some staying power above constitutes a “Buy” signal. Conversely, a clear break below the line constitutes a “Sell” signal. Additionally, I use a 7.5% trailing stop loss on all positions in these categories to control downside risk.

  1. All other investment arenas do not have a TTI and should be traded based on the position of the individual ETF relative to its own respective trend line (%M/A). That’s why those signals are referred to as a “Selective Buy.” In other words, if an ETF crosses its own trendline to the upside, a “Buy” signal is generated. Since these areas tend to be more volatile, I recommend a wider trailing sell stop of 7.5% -10% depending on your risk tolerance.

If you are unfamiliar with some of the terminology, please see Glossary of Terms and new subscriber information in section 9.


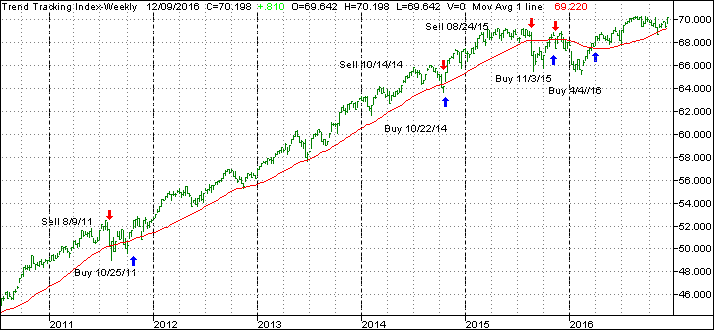
  1. DOMESTIC EQUITY ETFs: BUY — since 4/4/2016

tti

Our main directional indicator, the Domestic Trend Tracking Index (TTI-green line in the above chart) is positioned above its long-term trend line (red) by +1.52% after having generated a new Domestic Buy signal effective 4/4/2016 as posted.

Read More

And the Beat Goes On

Ulli Market Commentary Contact

thur-pic

[Chart courtesy of MarketWatch.com]
  1. Moving the Markets

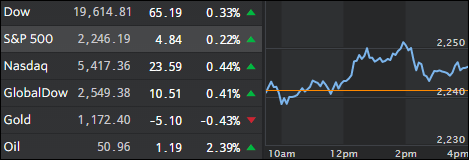
Despite ECB’s Mario Draghi not exactly fulfilling the dreams of European traders by offering a mixed monetary policy decision via his announcement that his asset buys will be continued although at a reduced pace (from $80 billion a month to $60 billion), it did not matter. European markets rallied anyway with the German DAX adding another +1.75%. Again, we’re stuck in this scenario where any kind of news is a good thing.

The US markets followed suit although at a lesser pace with the S&P 500 gaining +0.22%. Supporting today’s positive sentiment was a reduction in the number of Americans filing for unemployment benefits boosting hope that the labor market is strengthening. The post election optimism continues with full force as the path of least resistance has been higher.

A few days ago, I commented on the outcome of last weekend’s Italian referendum and the dire straits the entire Italian banking system finds itself in caused by $360 billion of non-performing loans. You’d think that this would be a further downer to Italian banking stocks, which have been demonstrating bearish behavior for quite some time now. Well, if you had thought that, you’d be dead wrong as Italian banks were the best stock market performer in the world this week. Take a look at this chart:

Read More