
1. Moving the Markets
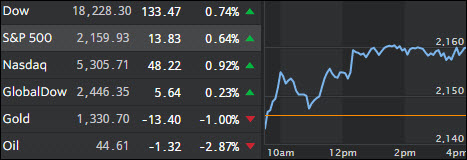
Stocks rallied following the first presidential debate, as investors digest the first face-off between Hillary and Donald. Stocks broke a two-day losing streak in the first trading session following the first of three face-to-face battles between the Democratic and Republican nominees for president, which some are suggesting that markets are giving the first-debate victory to Clinton. During the debate, candidates sparred over trade policies, taxes, national security and other key issues.
Equities were also reacting to decent news on consumer confidence. We heard today that the consumer confidence index for September jumped to a nine-year high of 104.1, which was better than August’s 101.8 reading.
In energy, U.S. Crude Oil prices tumbled after comments from Iran and after Saudi Arabia officials downplayed expectations of a possible oil production deal. Benchmark U.S. crude fell 3.3% to $44.42 a barrel. Crude was also hurt by a Goldman Sachs price downgrade. The Wall Street bank slashed its fourth-quarter oil-price forecast to $43 a barrel from $50 a barrel.
Deutsche Bank (DB) was in the news again as its stock tumbled towards the single digits but managed to close slightly in the green. DB is considered by some to be the “most systematically dangerous bank in the world.” As I said yesterday, “when,” not “if” it fails, the implications will be far reaching. This will not end well.
2. ETFs in the Spotlight
In case you missed the announcement and description of this section, you can read it here again.
It features 10 broadly diversified ETFs from my HighVolume list as posted every Monday. Furthermore, they are screened for the lowest MaxDD% number meaning they have been showing better resistance to temporary sell offs than all others over the past year.
Here are the 10 candidates:
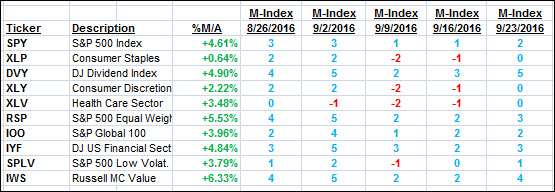
The above table simply demonstrates the magnitude with which some of the ETFs are fluctuating in regards to their positions above or below their respective individual trend lines (%M/A). A break below, represented by a negative number, shows weakness, while a break above, represented by a positive percentage, shows strength.
For hundreds of ETF choices, be sure to reference Thursday’s StatSheet.
Year to date, here’s how the above candidates have fared so far:
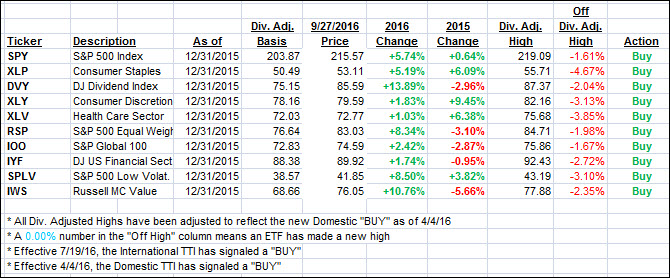
Again, the first table above shows the position of the various ETFs in relation to their respective long term trend lines (%M/A), while the second one tracks their trailing sell stops in the “Off High” column. The “Action” column will signal a “Sell” once the -7.5% point has been taken out in the “Off High” column.
3. Trend Tracking Indexes (TTIs)
Both of our Trend Tracking Indexes (TTIs) reversed as the downtrend of the past 2 days was broken.
Here’s how we closed 9/27/2016:
Domestic TTI: +2.46% (last close +2.17%)—Buy signal effective 4/4/2016
International TTI: +4.37% (last close +4.20%)—Buy signal effective 7/19/2016
Disclosure: I am obliged to inform you that I, as well as my advisory clients, own some of the ETFs listed in the above table. Furthermore, they do not represent a specific investment recommendation for you, they merely show which ETFs from the universe I track are falling within the guidelines specified.
Contact Ulli