
1. Moving the Markets
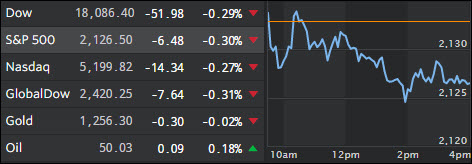
Despite BofA reporting its first profit increase in three quarters, it wasn’t enough to keep the markets above the unchanged line. Offsetting the positive tone were some weak economic data points in form of industrial production contracting for the 13th straight month, its longest non-recessionary streak ever. Adding to this misery was a big miss by the Empire Fed with the index sliding to 5 months lows as new orders continued to skid.
Against this backdrop, conflicting statements in regards to the timing of a possible rate hike has kept everybody on edge. There was Fed Vice Chairman Fischer’s warning that “economic stability” could be threatened by low interest rates yet he mentioned that “it was not that simple” for the Fed to raise rates. Of course it’s not that simple if you are beholden to Wall Street and are trying to avoid a correction to fair market value at all costs.
So, it appears that, all of a sudden, low interest rates are no longer a good thing and neither are higher ones. If you find that confusing, you are not the only one. I don’t think there is any better way to talk out of both sides of your mouth, but we’ll have to wait and see if we will hear more non-committal words of Fed wisdom in the future.
2. ETFs in the Spotlight
In case you missed the announcement and description of this section, you can read it here again.
It features 10 broadly diversified ETFs from my HighVolume list as posted every Monday. Furthermore, they are screened for the lowest MaxDD% number meaning they have been showing better resistance to temporary sell offs than all others over the past year.
Here are the 10 candidates:
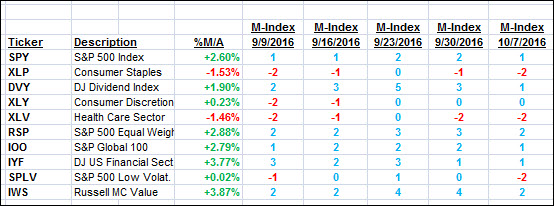
The above table simply demonstrates the magnitude with which some of the ETFs are fluctuating in regards to their positions above or below their respective individual trend lines (%M/A). A break below, represented by a negative number, shows weakness, while a break above, represented by a positive percentage, shows strength.
For hundreds of ETF choices, be sure to reference Thursday’s StatSheet.
Year to date, here’s how the above candidates have fared so far:
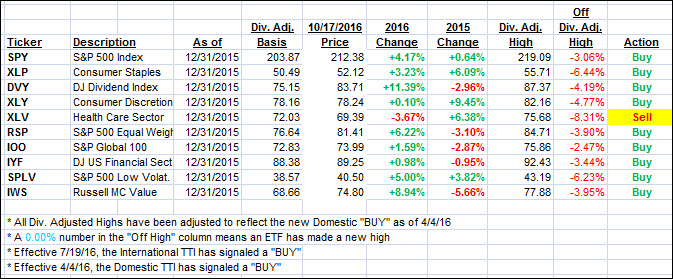
Again, the first table above shows the position of the various ETFs in relation to their respective long term trend lines (%M/A), while the second one tracks their trailing sell stops in the “Off High” column. The “Action” column will signal a “Sell” once the -7.5% point has been taken out in the “Off High” column.
3. Trend Tracking Indexes (TTIs)
Both of our Trend Tracking Indexes (TTIs) slipped a tad as the major indexes closed down.
Here’s how we closed 10/17/2016:
Domestic TTI: +1.22% (last Friday +1.32%)—Buy signal effective 4/4/2016
International TTI: +2.56% (last Friday +2.76%)—Buy signal effective 7/19/2016
Disclosure: I am obliged to inform you that I, as well as my advisory clients, own some of the ETFs listed in the above table. Furthermore, they do not represent a specific investment recommendation for you, they merely show which ETFs from the universe I track are falling within the guidelines specified.
Contact Ulli