Fed Confirms Inflation Concerns

Ulli Market Commentary Contact

wed-pic

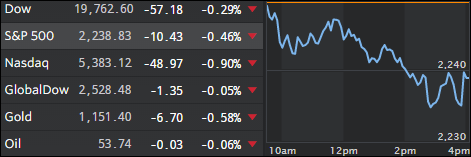
[Chart courtesy of MarketWatch.com]
  1. Moving the Markets

The Fed minutes of their December meeting were the most anticipated event of the day. They revealed concerns that accelerating economic growth under Trump’s stimulus plan might require faster interest rate hikes to get a handle on the accompanying inflation. This is about as hawkish of a statement the Fed has released in the past 2 years.

The markets took it as a positive for the time being based on the hope that as long as GDP grows proportionately, the inflation scenario should be manageable, or so the theory goes.

On the other hand, it was extremely low interest rates, along with the Fed’s promise to keep them that way, and not economic fundamentals, which fueled the rally since the 2008 financial crisis. But now, it’s supposed to be the opposite. We’ll find out how that is going to work…

On the economic side, we learned that the “Refi-Boom” has crashed to lows not seen since late 2008. Down over 60% since August, the re-fi index crashed over 22% over the Christmas/New Year period.

Another crash happened after hours and this one in stock prices for Macy’s and Kohl’s. Slashing their full-year forecast, adjusting EPS down along with sales and laying off thousands is a downer for retail, which confirms what I have been posting about before, namely that the economy and the stock market are totally disconnected. The question in my mind is “who’s next in admitting poor retail data and at what point will equities be affected?”

Read More

Early Market Euphoria Fades

Ulli Market Commentary Contact

tue-pic

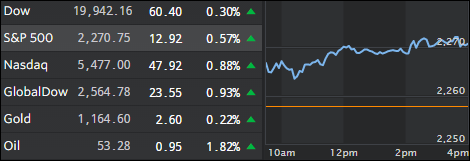
[Chart courtesy of MarketWatch.com]
  1. Moving the Markets

The markets started the New Year with a bang as the Dow attempted another run at 20k but fell short in the end as a mid-day sell-off pulled the rug out from the early rally. Late day buying put the major indexes deeper into the green for day, but it was not enough to reach and take out the morning highs. Nevertheless, the gains for the day were solid.

It was a wild ride as interest rates rose worldwide, but while the US 10-year yield headed north at first it ended up lower at 2.45%. Oil went into hyper-drive by touching the $55/barrel level and then crashing to end up at $52.56 for a loss from high to low of -4.4%.

Better than expected manufacturing data sent the US dollar surging, with the index now racing above its 2016 highs to its highest level since 2002. If this continues, there may be dire consequences, economically speaking, as the following areas will likely be affected:

  1. Corporate profits (47% of corporate sales from abroad)
  2. GDP growth
  3. Bonds (debt deflation)
  4. Mortgages and home refinancing
  5. US manufacturing

Indeed, there are few if any benefits to a strong $USD in the current fiat, debt-based monetary system the Fed is managing. Pushing for three (more) rate hikes with the $USD at 102 is like pushing your friend to drink three more beers when he’s already got alcohol poisoning.

Read More

One Man’s Opinion: “Year In Reviews” Are Boring … Let’s Review the Last 5,000 Years

Ulli Market Review Contact

OneMan'sOpinionBy George Washington

We’ve known for 5,000 years that mass spying on one’s own people is usually aimed at grabbing power and crushing dissent, not protecting us from bad guys.

We’ve known for 4,000 years that debts need to be periodically written down, or the entire economy will collapse. And see this.

We’ve known for 2,500 years that prolonged war bankrupts an economy.

We’ve known for 2,000 years that wars are based on lies.

We’ve known for 1,900 years that runaway inequality destroys societies. … and leads to revolution.

We’ve known for 1,700 years that torture is a form of terrorism.

We’ve known for thousands of years that debasing currencies leads to economic collapse.

We’ve known for millenia that – when criminals are not punished – crime spreads.

We’ve known for thousands of years that the rich and powerful try to censor their critics under the guise of heresy.

We’ve known for hundreds of years that the failure to punish financial fraud destroys economies, as it destroys all trust in the financial system.

Read More

ETFs On The Cutline – Updated Through 12/30/2016

Ulli ETFs on the Cutline Contact

Below please find the latest High Volume ETFs Cutline report, which shows how far above or below their respective long-term trend lines (39 week SMA) my currently tracked ETFs are positioned.

This report covers the HV ETF Master List from Thursday’s StatSheet and includes 366 High Volume ETFs ETFs, defined as those with an average daily volume of more than $5 million, of which currently 201 (last week 191) are hovering in bullish territory. The yellow line separates those ETFs that are positioned above their trend line from those that have dropped below it.

Take a look:

The HV ETF Master Cutline Report            

In case you are not familiar with some of the terminology used in the reports, please read the Glossary of Terms.

If you missed the original post about the Cutline approach, you can read it here.

ETF Tracker Newsletter For December 30, 2016

Ulli ETF Tracker Contact

ETF Tracker StatSheet

https://theetfbully.com/2016/12/weekly-statsheet-for-the-etf-tracker-newsletter-updated-through-12292016/

Market Commentary

Year End Resistance

fri-pic

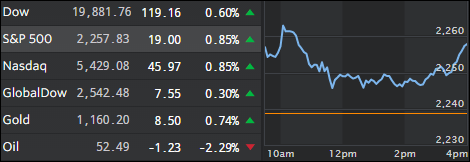
[Chart courtesy of MarketWatch.com]
  1. Moving the Markets

For sure, I thought there would have been a last minute attempt at reaching the much talked about 20k Dow level during this last trading week of 2016, but it did not happen.

Actually, the post election momentum reversed with the S&P 500 declining for a third consecutive session but managed to gain 9.5% for the year thanks to Fed intervention back in February and mid-year during the Brexit drop.

Of course, the Trump pump in the face of rising interest rates helped the indexes big time, but it remains to be seen if there is any staying power once Trump takes over on January 20th when underlying economic realities are certain to surface along with the fact that his ambitious plans may run into opposition even within his own party.

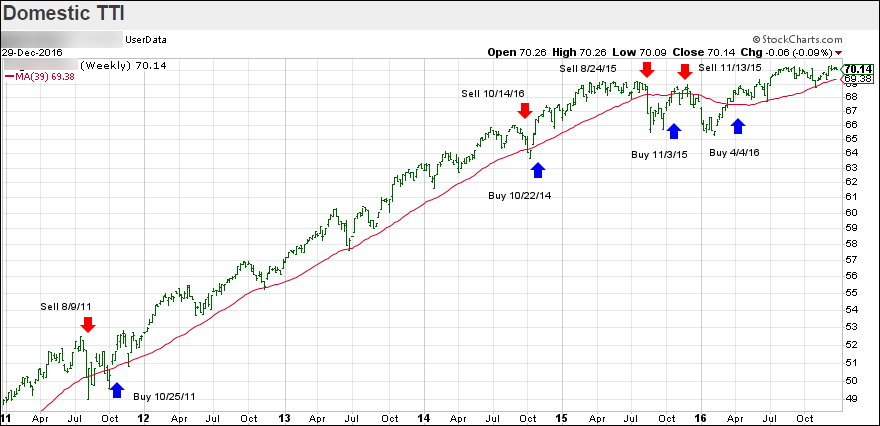
Despite the market euphoria of the past 6 weeks, our main directional indicator, the Domestic TTI, see section 3 below for the latest update, did not play along by advancing only modestly indicating a lack of conviction due to a rising interest rate environment, which will eventually be negative for equities. Be sure to stay tuned for the latest updates as the New Year gets underway.

Read More

Weekly StatSheet For The ETF Tracker Newsletter – Updated Through 12/29/2016

Ulli ETF StatSheet Contact

ETF Data updated through Wednesday, December 29, 2016

TOC082516

Methodology/Use of this StatSheet:

  1. From the universe of over 1,800 ETFs, I have selected only those with a trading volume of over $5 million per day (HV ETFs), so that liquidity and a small bid/ask spread are assured.
  2. Trend Tracking Indexes (TTIs)

Buy or Sell decisions for Domestic and International ETFs (section 1 and 2), are made based on the respective TTI and its position either above or below its long-term M/A (Moving Average). A crossing of the trend line from below accompanied by some staying power above constitutes a “Buy” signal. Conversely, a clear break below the line constitutes a “Sell” signal. Additionally, I use a 7.5% trailing stop loss on all positions in these categories to control downside risk.

  1. All other investment arenas do not have a TTI and should be traded based on the position of the individual ETF relative to its own respective trend line (%M/A). That’s why those signals are referred to as a “Selective Buy.” In other words, if an ETF crosses its own trendline to the upside, a “Buy” signal is generated. Since these areas tend to be more volatile, I recommend a wider trailing sell stop of 7.5% -10% depending on your risk tolerance.

If you are unfamiliar with some of the terminology, please see Glossary of Terms and new subscriber information in section 9.


  1. DOMESTIC EQUITY ETFs: BUY — since 4/4/2016

ttiClick on chart to enlarge

Our main directional indicator, the Domestic Trend Tracking Index (TTI-green line in the above chart) is positioned above its long-term trend line (red) by +1.16% after having generated a new Domestic Buy signal effective 4/4/2016 as posted.

Read More