
- Moving the Markets
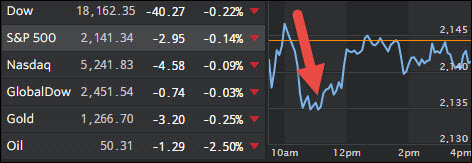
Markets were a little chaotic early in the session as the major indexes had rallied and then collapsed below the trend line very quickly as the chart above shows. Slowly but surely, we recovered, touched the unchanged line a few times but ended up closing slightly below it.
Economic data points continued their downward path with jobless claims jumping the most in over 5 months, existing home sales growth stalling (yet prices kept rising) while consumer confidence slipped to the lowest since last year. In other words, the economy is going nowhere fast.
Over in Europe, the ECB disappointed by not considering a QE extension beyond March and Draghi announcing that “extraordinary policy support won’t exist forever.” Of course, things in Europe work the same as here in the US and bad market news ended up being good news, as an early sell off was followed by a broad recovery with the German DAX closing up +0.52%. Go figure…
- ETFs in the Spotlight
In case you missed the announcement and description of this section, you can read it here again.
It features 10 broadly diversified ETFs from my HighVolume list as posted every Monday. Furthermore, they are screened for the lowest MaxDD% number meaning they have been showing better resistance to temporary sell offs than all others over the past year.
Here are the 10 candidates:
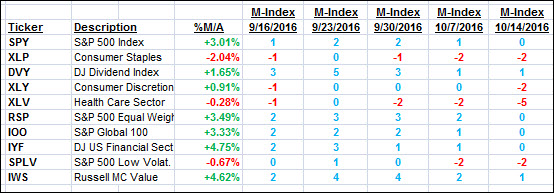
The above table simply demonstrates the magnitude with which some of the ETFs are fluctuating in regards to their positions above or below their respective individual trend lines (%M/A). A break below, represented by a negative number, shows weakness, while a break above, represented by a positive percentage, shows strength.
For hundreds of ETF choices, be sure to reference Thursday’s StatSheet.
Year to date, here’s how the above candidates have fared so far:
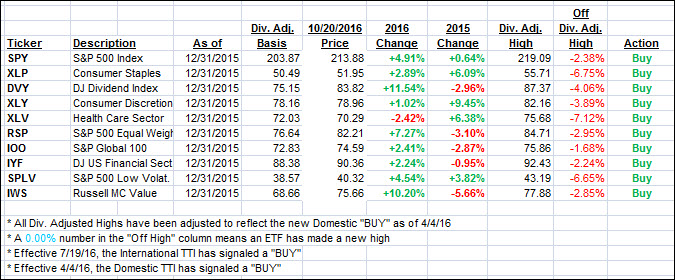
Again, the first table above shows the position of the various ETFs in relation to their respective long term trend lines (%M/A), while the second one tracks their trailing sell stops in the “Off High” column. The “Action” column will signal a “Sell” once the -7.5% point has been taken out in the “Off High” column.
- Trend Tracking Indexes (TTIs)
Our Domestic Trend Tracking Index (TTI) slipped a tad while the International one remained unchanged.
Here’s how we closed 10/20/2016:
Domestic TTI: +1.47% (last close +1.60%)—Buy signal effective 4/4/2016
International TTI: +3.66% (last close +3.66%)—Buy signal effective 7/19/2016
Disclosure: I am obliged to inform you that I, as well as my advisory clients, own some of the ETFs listed in the above table. Furthermore, they do not represent a specific investment recommendation for you, they merely show which ETFs from the universe I track are falling within the guidelines specified.
Contact Ulli