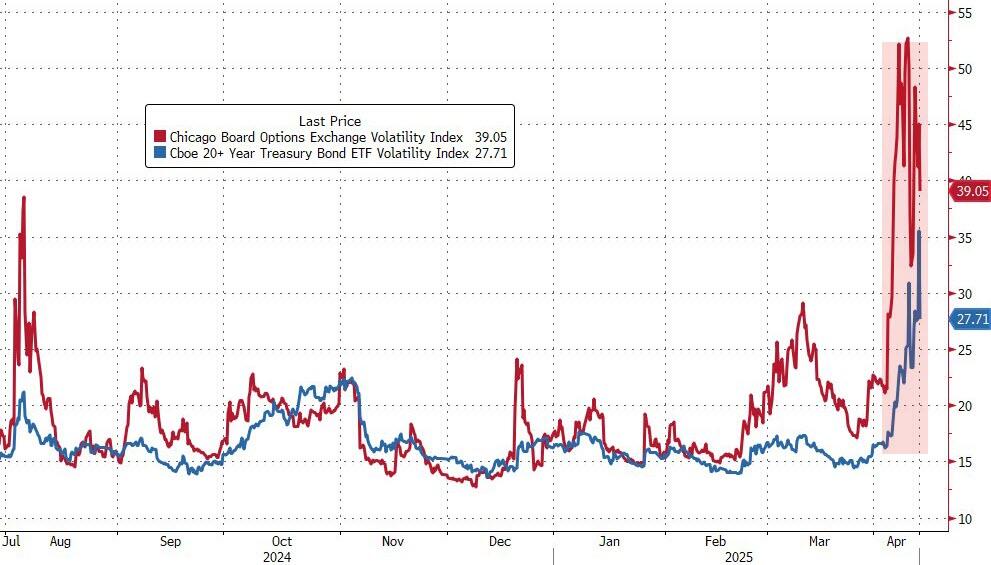
The major indexes cautiously advanced early on as traders analyzed the latest earnings reports and enjoyed a decline in market volatility, indicated by a drop in the VIX.
Yesterday, tech stocks received a boost following revelations of exemptions from reciprocal tariffs for electronic products such as smartphones, computers, and semiconductors. Even though later clarifications suggested these exemptions might be temporary, the bulls continued to push the indexes higher.
While equities are still recovering from losses incurred after Trump’s original tariff announcement, concerns persist that more headline-driven volatility could disrupt the current rebound at any time.
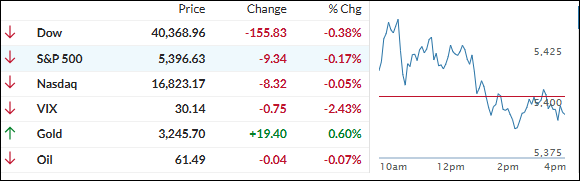
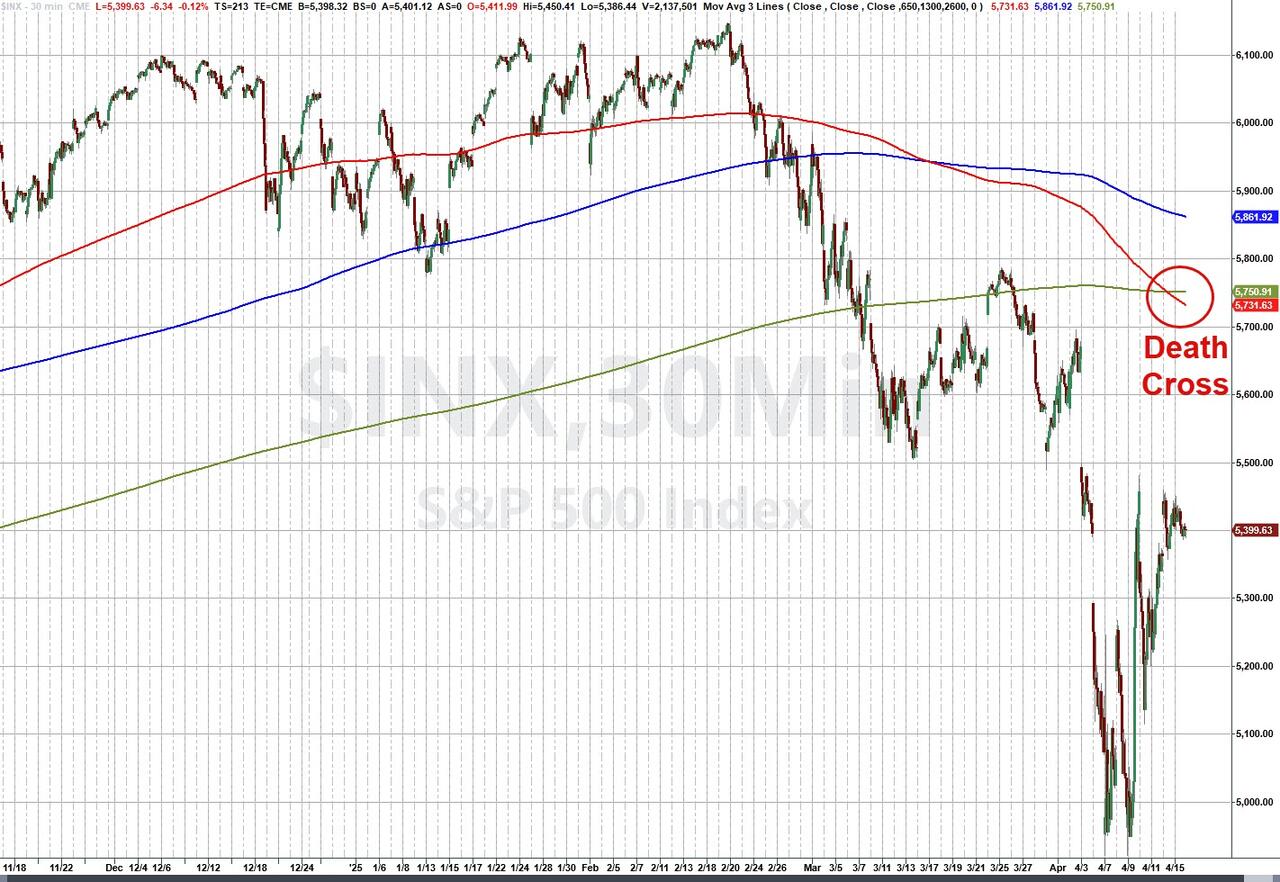
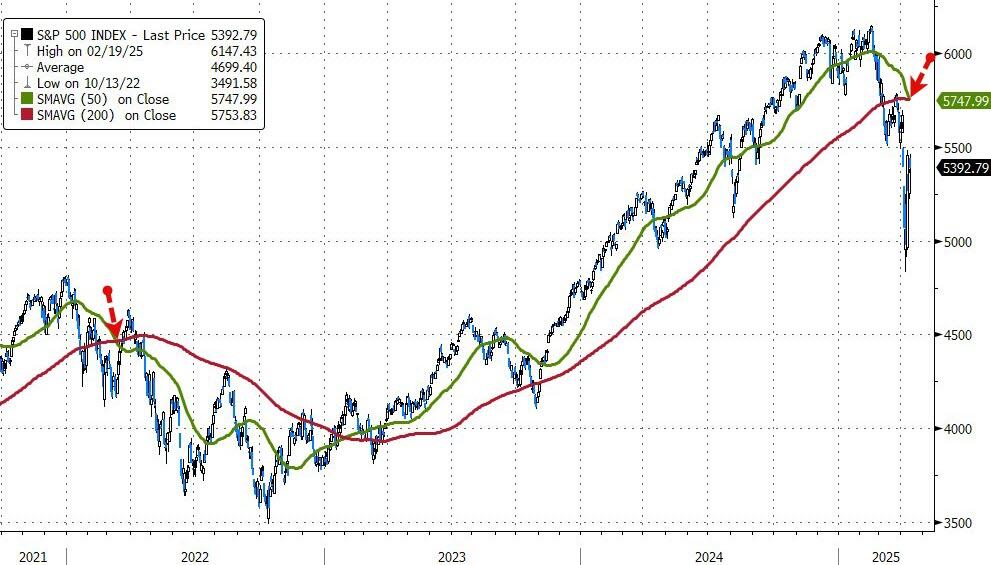
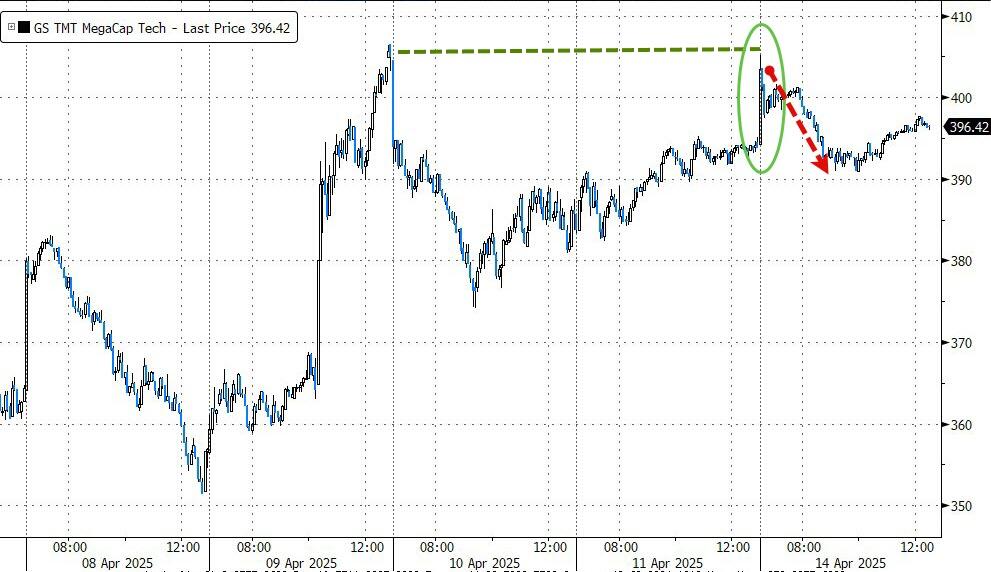
Ultimately, the initial short squeeze faded as anxiety grew, leading the major indexes to close moderately in the red, while the S&P 500 “death cross” remained in play.
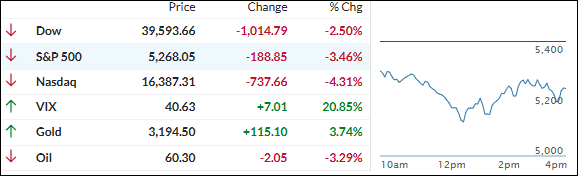
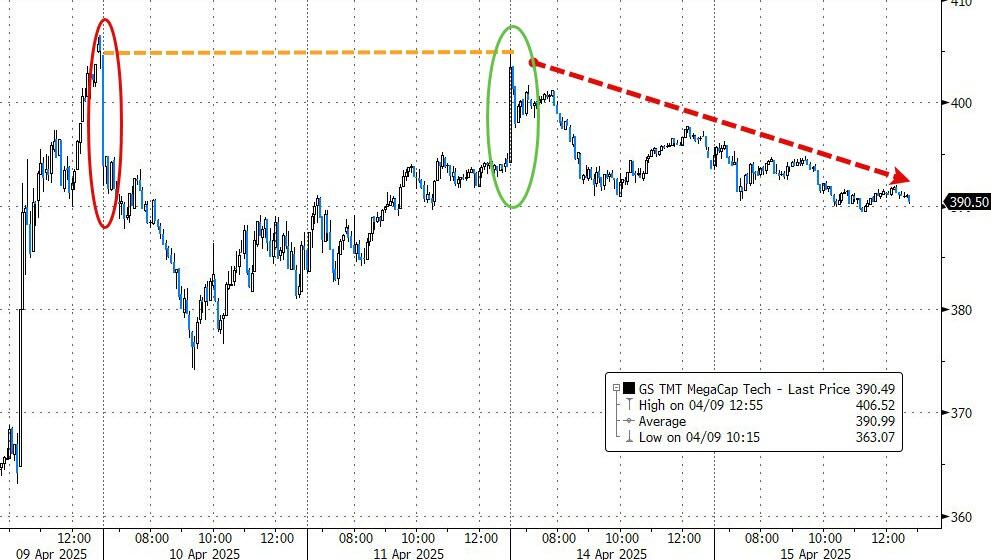
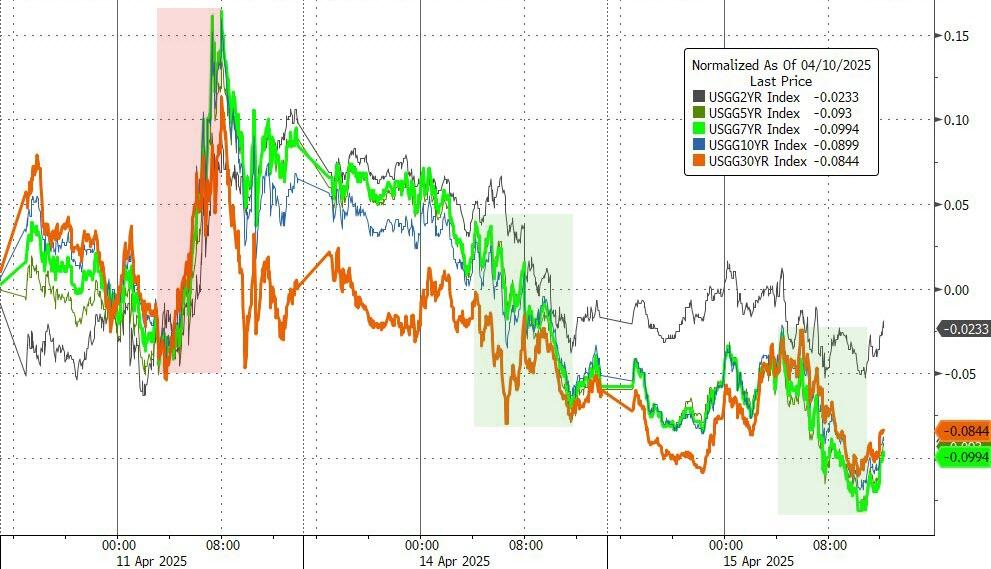
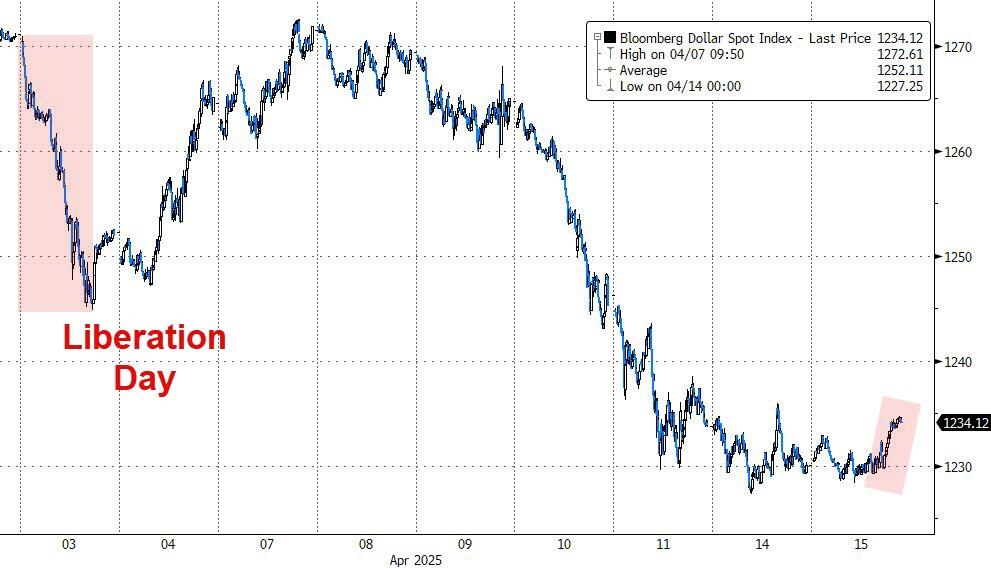
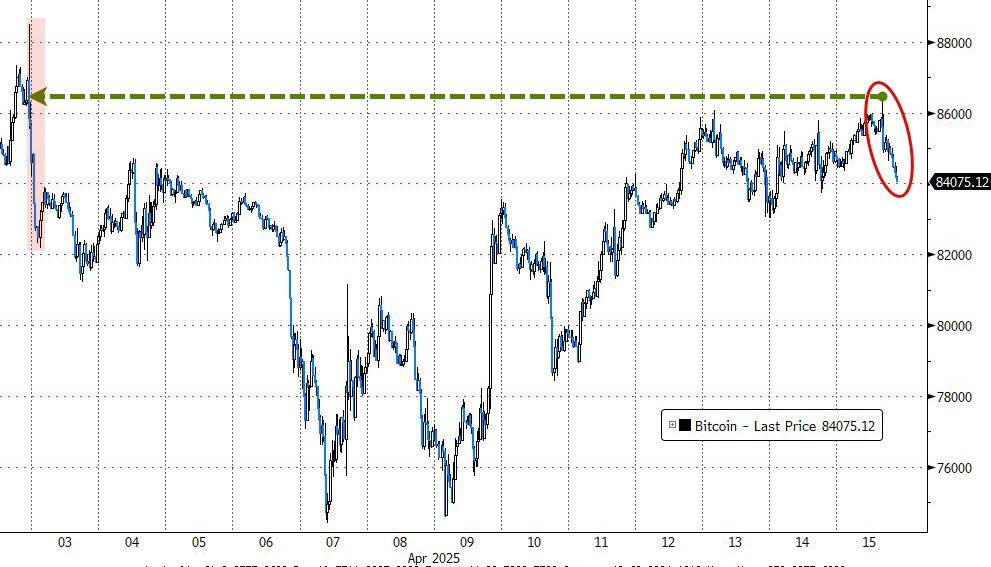
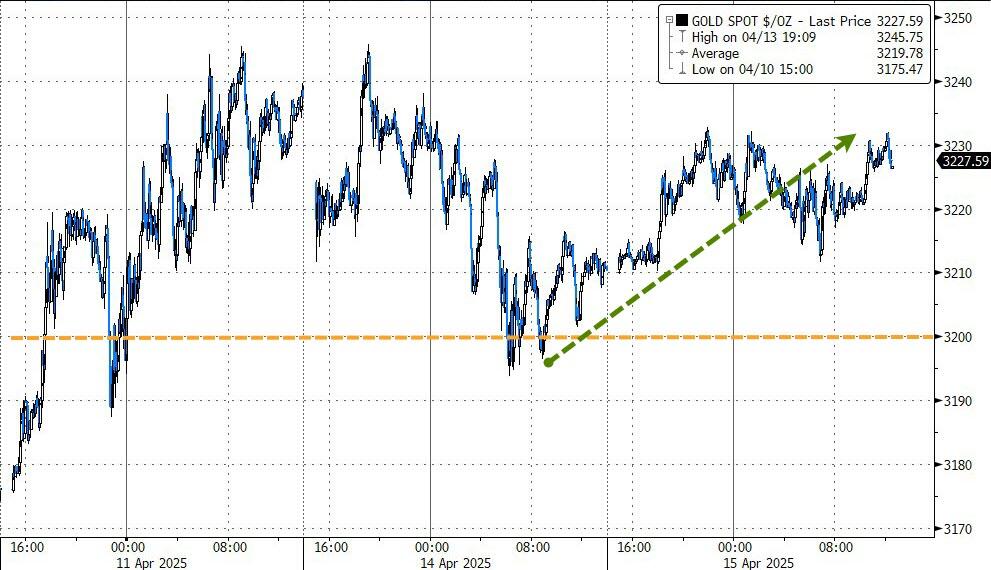
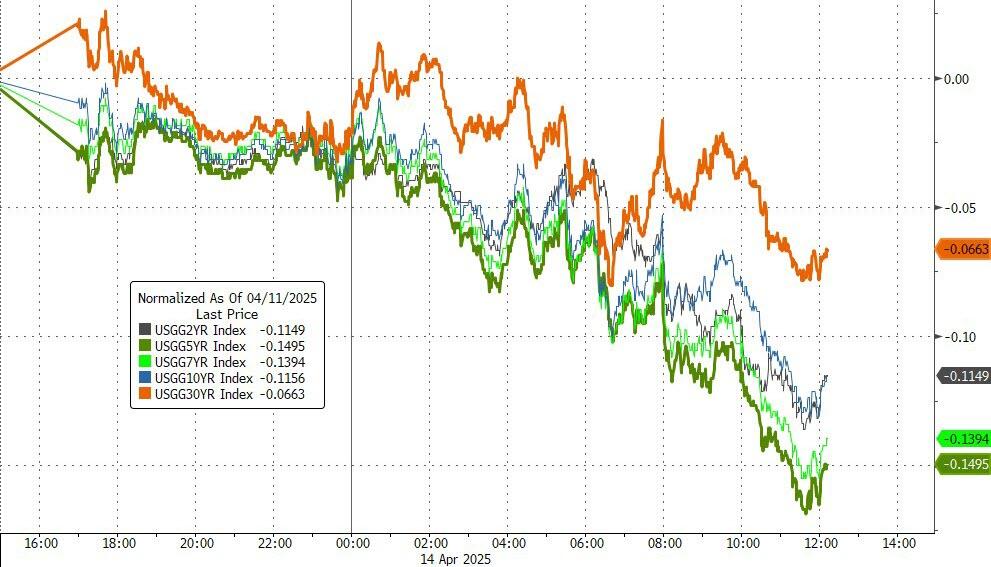
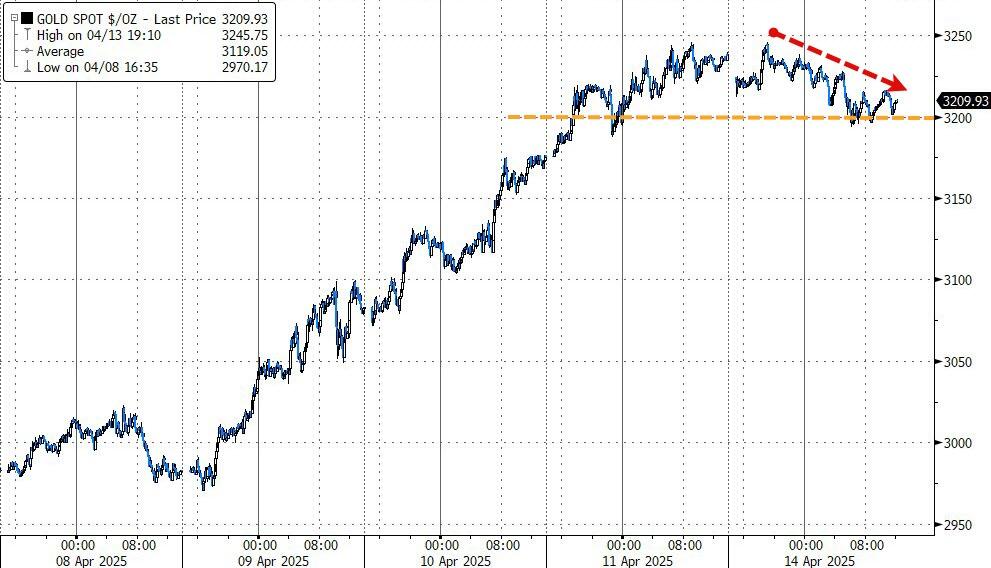
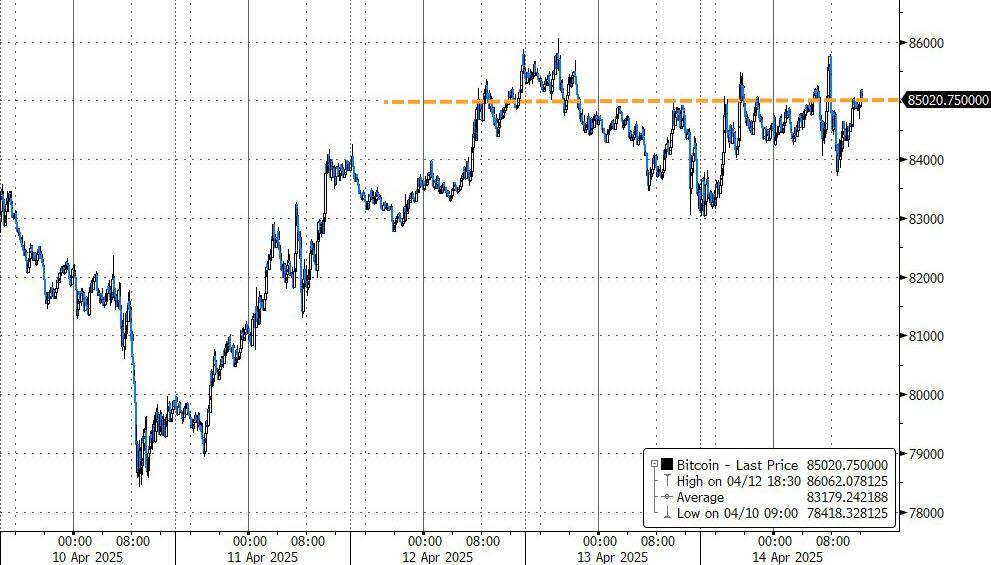
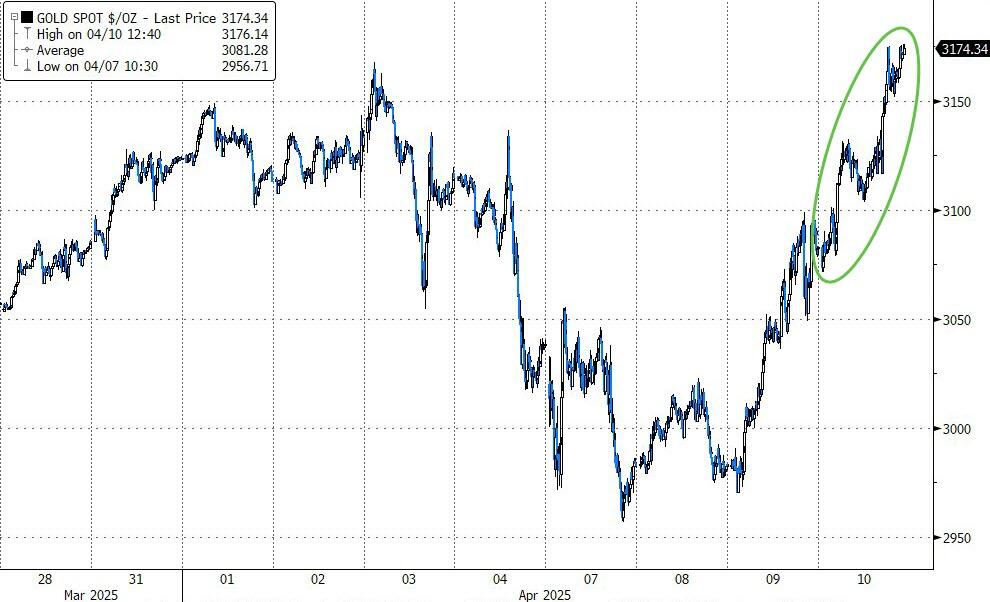
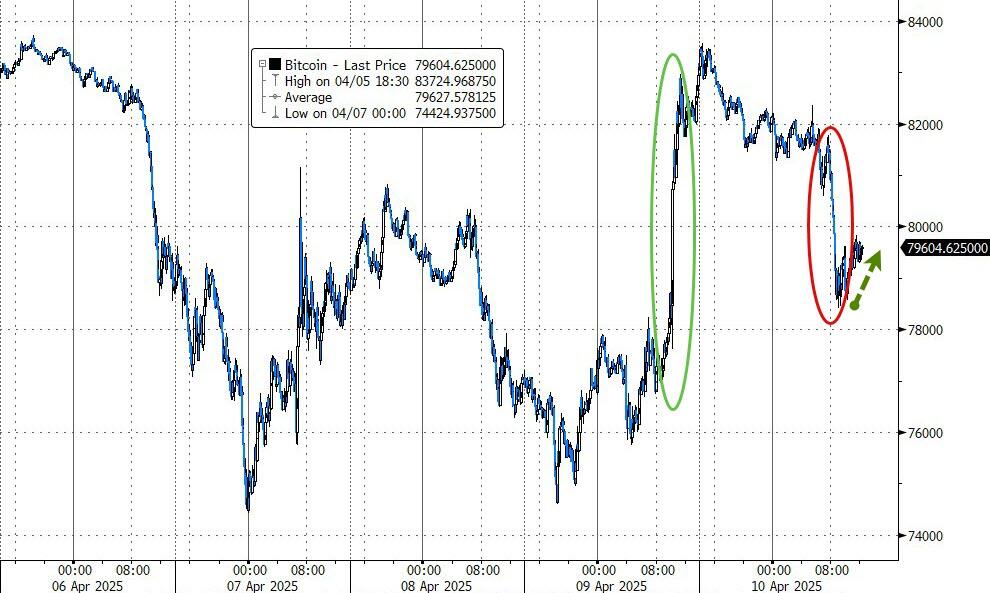
The mega-cap sector continued its slide despite lower bond yields, but the dollar managed to eke out a modest gain. Bitcoin rallied to $86k before retreating to the $84k level, while gold ignored the dollar’s strength and climbed to around $3,250.
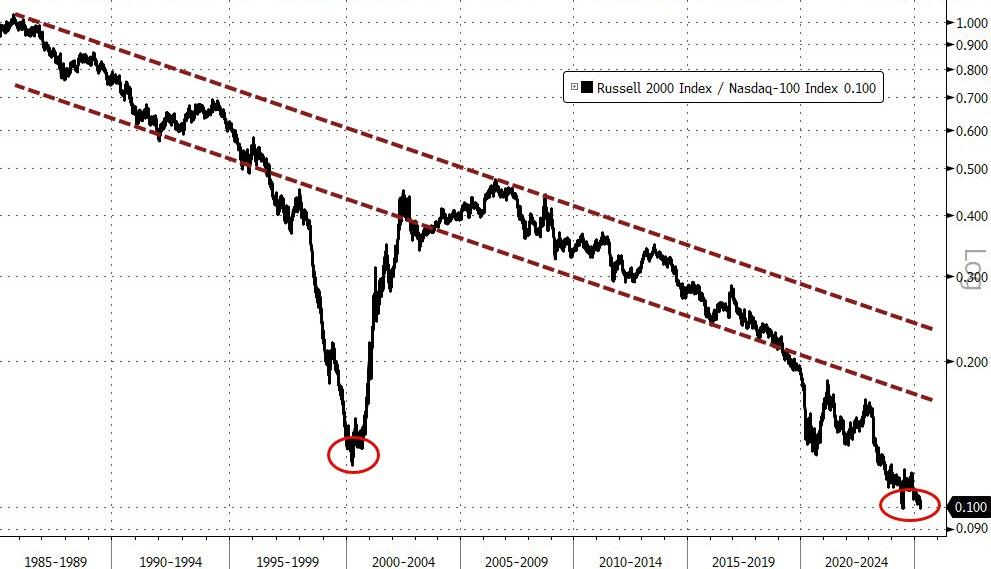
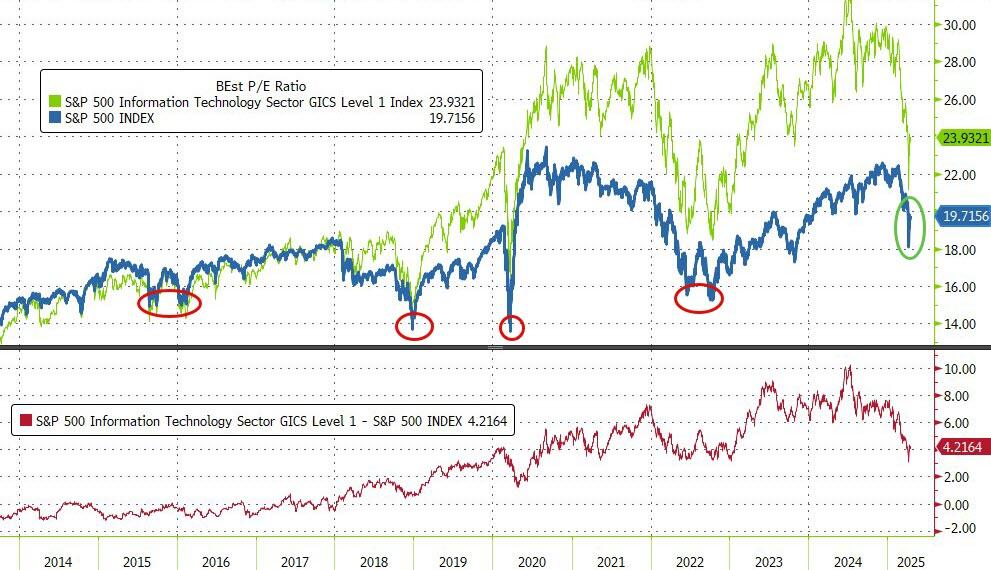
Interestingly, as ZH pointed out, SmallCaps have never been this low relative to the Nasdaq, yet the S&P 500 remains far from the prior valuation levels that marked a low.
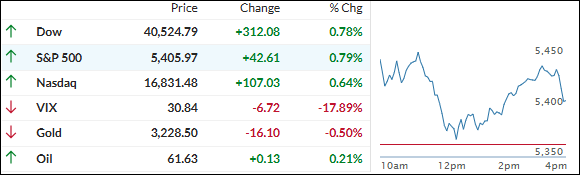
Positive news on tariffs boosted the markets early on, as Trump’s unexpected tariff exemption for tech devices lifted equities alongside lower bond yields.
Smartphones, computers, and components like semiconductors were excluded from the new reciprocal levies, according to guidance issued last Friday. Tech giants such as Apple, Nvidia, Intel, and Dell saw significant gains, with the entire tech sector (XLK) rising by approximately 2%.
However, these exemptions are not permanent and may still be subject to the existing 20% Fentanyl tariffs, merely shifting to a different “tariff bucket.” Nonetheless, traders welcomed the news for the day.
Despite last week’s rally, the three major indexes remain sharply down since the reciprocal tariffs were announced, as uncertainty continues to influence the long-term trend.
Today saw another volatile session with an early bounce fading, but upward momentum returned, leading to a positive close. The last 10 minutes, however, experienced heavy selling pressure, as noted by ZH.
Additionally, the S&P 500 triggered a “death cross,” a bearish signal where the 50-day moving average crosses below the 200-day moving average.
Do you want to know which ETFs are hot and which ones are not? Then you need my High-Volume ETF Cutline report. It tells you how close or far each of the 311 ETFs I follow is from its long-term trend line (39-week SMA). These are the ETFs that trade more than $5 million a day, so they are not some obscure funds that nobody cares about.
The report is split into two parts: The winners that are above their trend line (%M/A), and the losers that are below it. The yellow line is the line of shame that separates them. You can see how many ETFs are in each group and how they have changed since the last report (49 vs. 48 current).
GOLD SHINES AS EQUITIES SWING AND INFLATION HITS RECORD HIGHS
[Chart courtesy of MarketWatch.com]
Moving the market
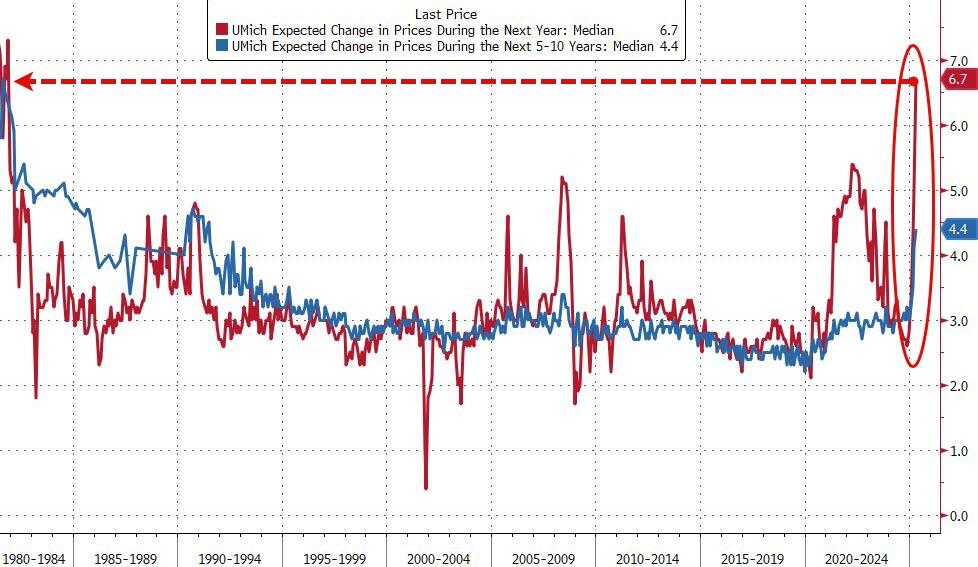
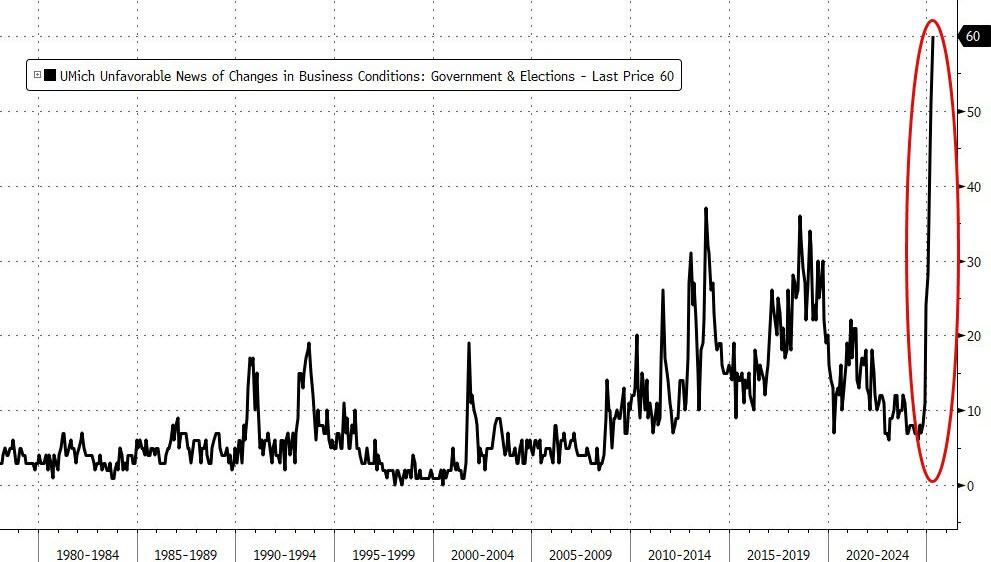
The stock market experienced another volatile opening, with equities swinging sharply due to worse-than-expected consumer sentiment for April. The index dropped from March’s 57.0 to 50.8, significantly below the expected 54.6.
Inflation concerns surged, rising from 5% in March to 6.7% in April, marking the highest level since November 1981. Other survey measures also indicated deterioration.
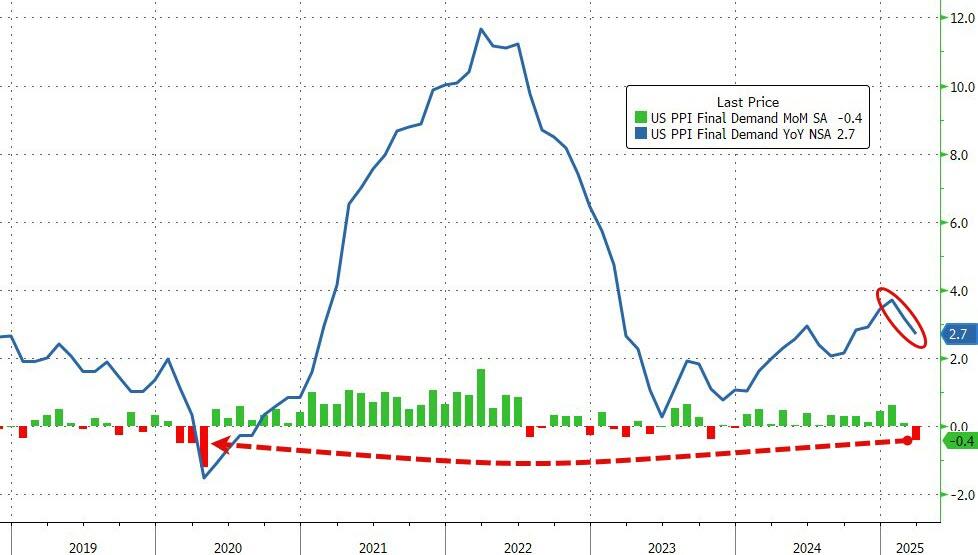
However, Producer Prices saw the largest drop since the COVID-19 pandemic, with a 0.4% month-over-month decrease, bringing the year-over-year index down to 2.7%.
This week has been one of the most volatile in Wall Street history. Trade policy uncertainties have caused major indexes to remain solidly in the red for 2025, despite a rebound this week.
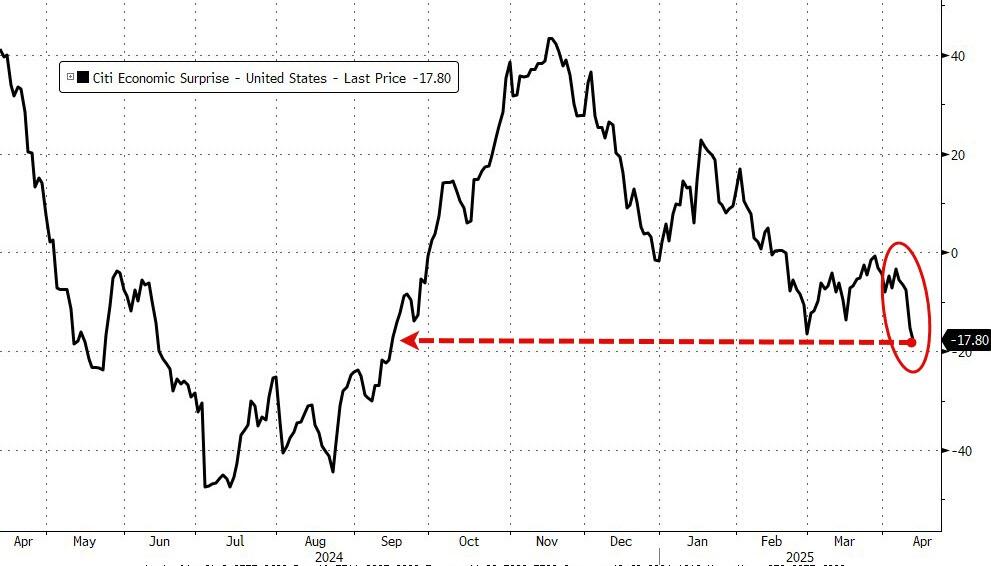
The US Macro Surprise Index, which had bounced off its lows in March, reversed and reached its weakest point since September. Financial conditions tightened dramatically, yet the Federal Reserve remained stoic and non-committal.
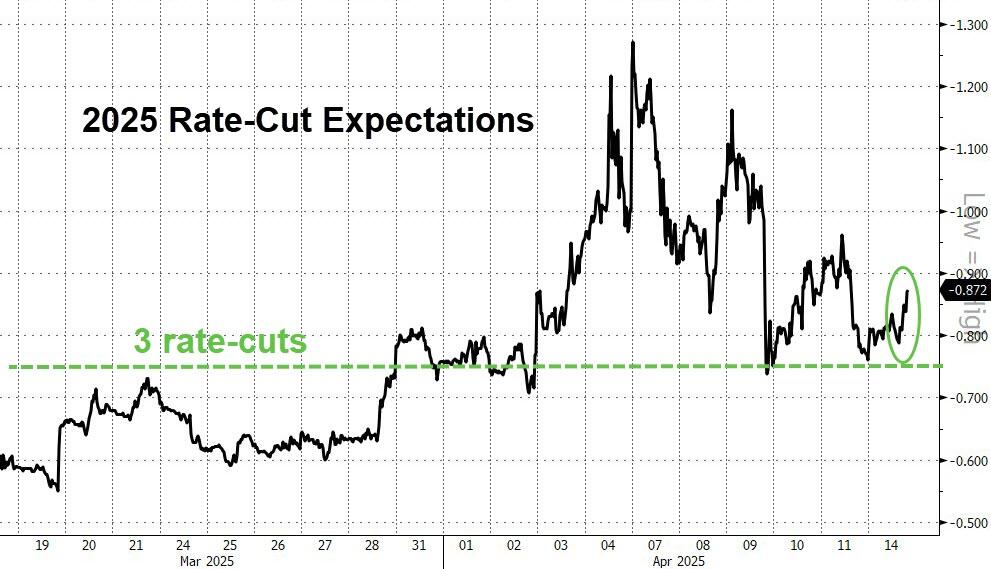
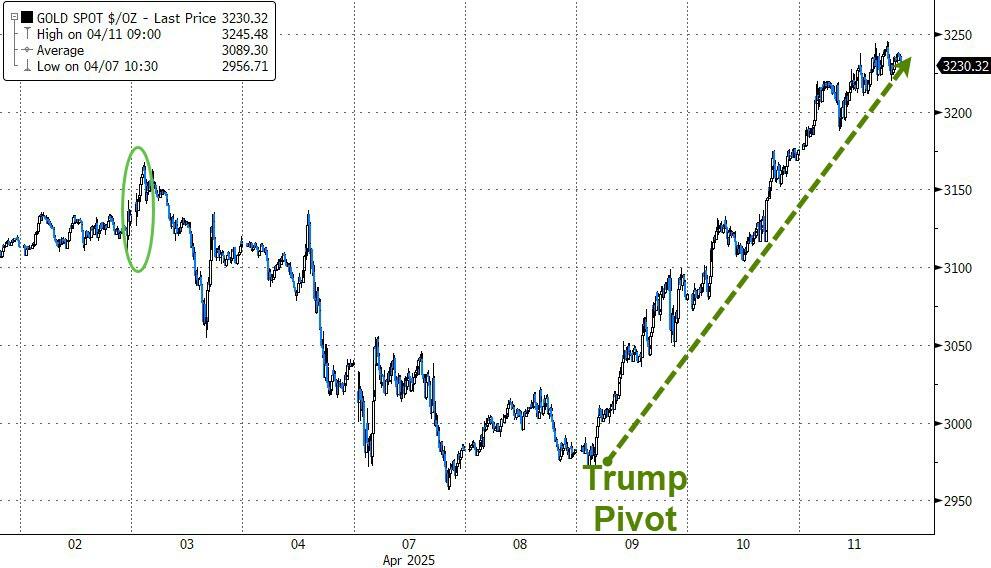
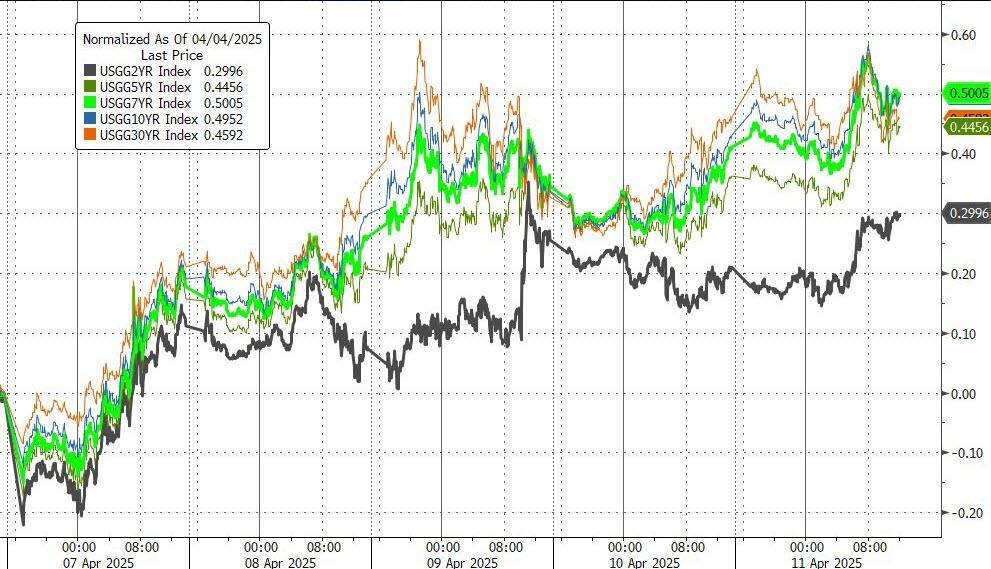
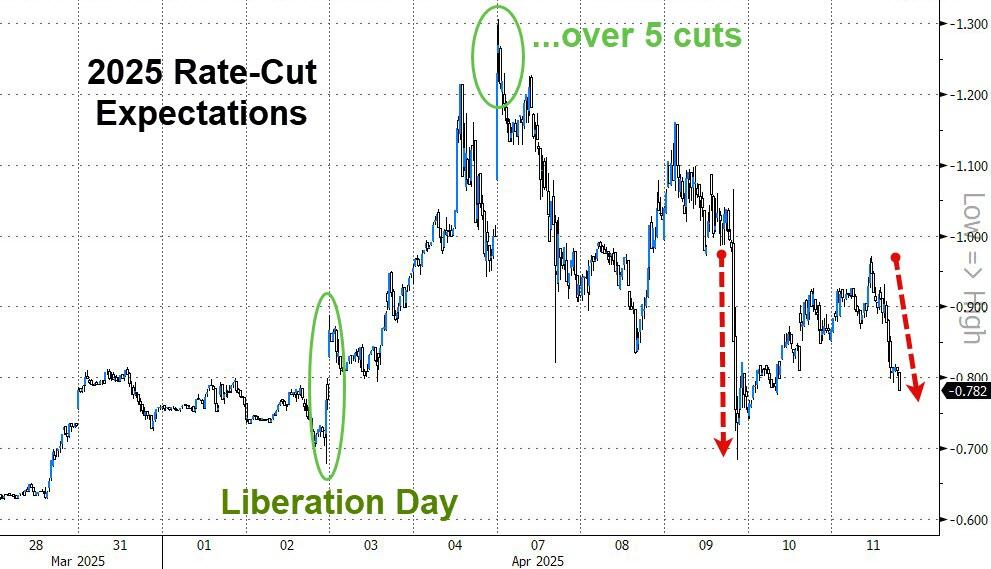
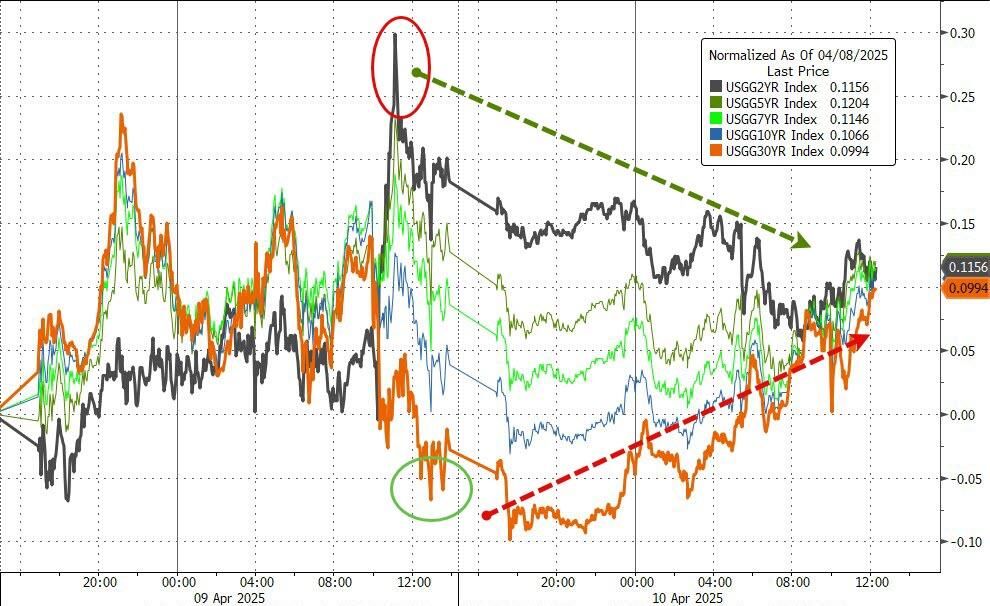
Gold emerged as the performance leader, achieving its best week since March 2020 amid rising bond yields. Rate-cut expectations plummeted as bond volatility surged, indicating underlying stress in the market.
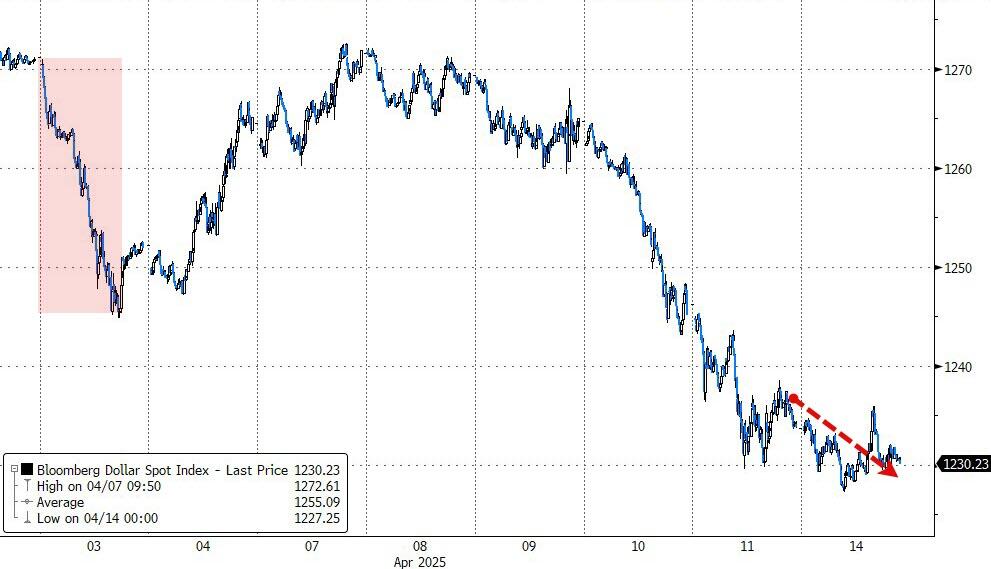
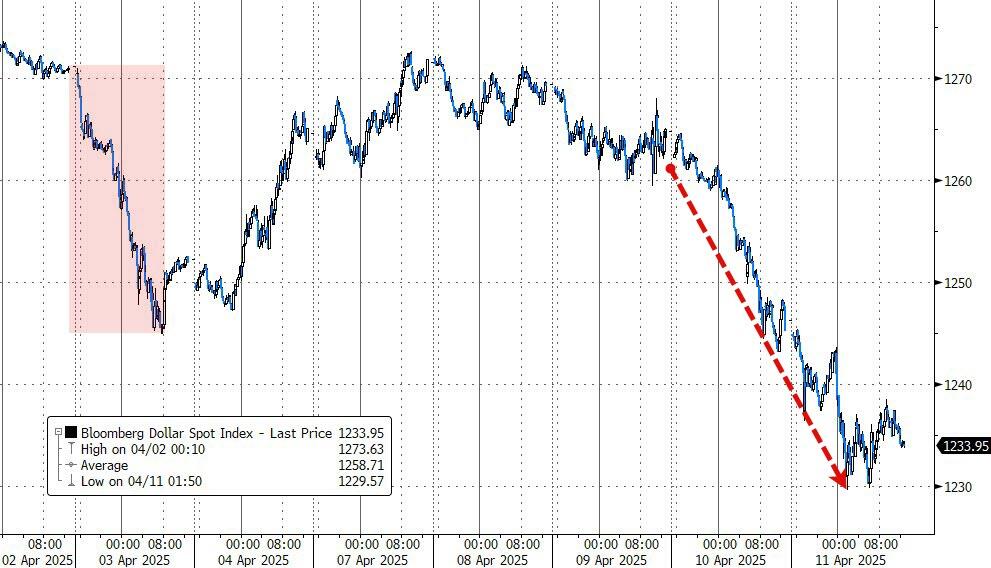
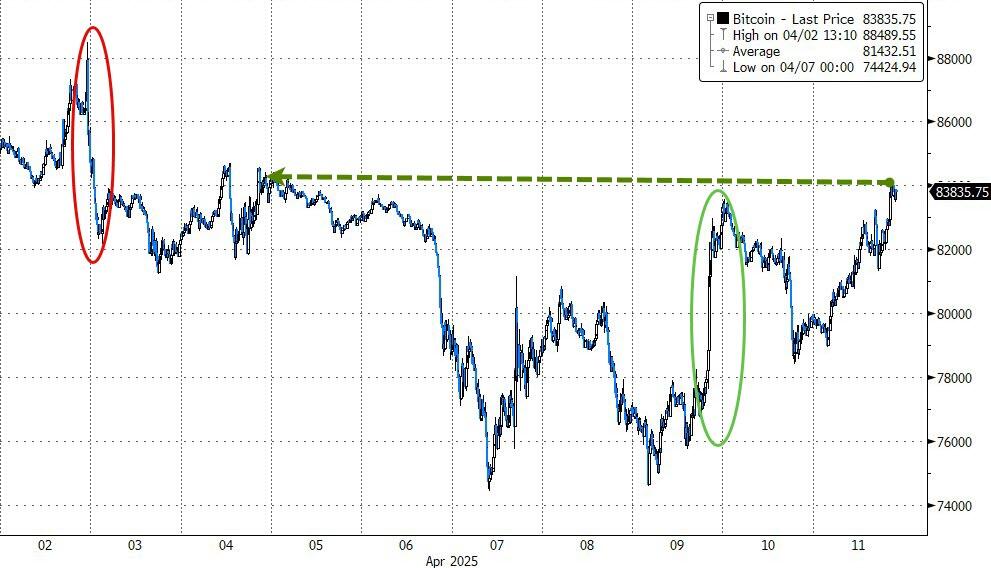
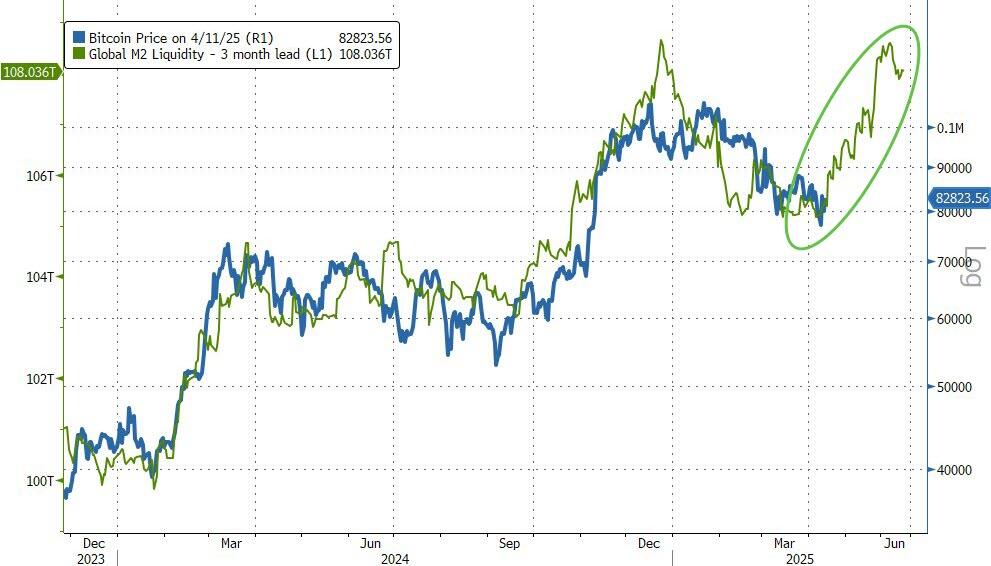
The dollar experienced its worst two-week drop since November 2022, while Bitcoin had its best week since early January, potentially entering a strong period if historical liquidity trends hold true.
Out of the 1,800+ ETFs out there, I only pick the ones that trade over $5 million per day (HV ETFs), so you don’t get stuck with a lemon that nobody wants to buy or sell.
Trend Tracking Indexes (TTIs)
These are the main indicators that tell you when to buy or sell Domestic and International ETFs (section 1 and 2). They do that by comparing their position to their long-term M/A (Moving Average). If they cross above, and stay there, it’s a green light to buy. If they fall below, and keep going, it’s a red light to sell. And to make sure you don’t lose your shirt if things go south, I also use a 12% trailing stop loss on all positions in these categories.
All other investment areas don’t have a TTI and should be traded based on the position of each ETF relative to its own trend line (%M/A). That’s why I call them “Selective Buy.” In other words, if an ETF goes above its own trend line, you can buy it. But don’t forget to use a trailing sell stop of 12%, or less if you’re feeling nervous.
If some of these words sound like Greek to you, please check out the Glossary of Terms and new subscriber information in section 9.
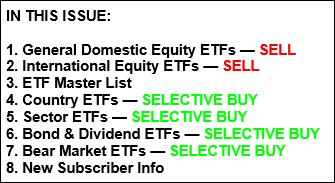
DOMESTIC EQUITY ETFs: SELL— effective 4/4/2025
Click on chart to enlarge
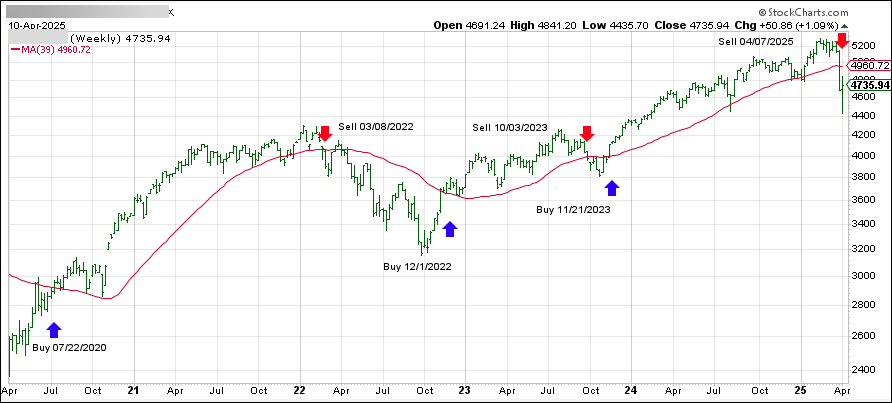
This is our main compass, the Domestic Trend Tracking Index (TTI-green line in the above chart). It has broken below its long-term trend line (red) by -8.86% and has now moved into “Sell” mode as of 4/4/2025.
The link below shows all High Volume (HV) Domestic Equity ETFs. They are ranked by M-Index, which is my secret sauce for measuring momentum. Prices in all linked tables below are updated through 04/10/2025, unless otherwise noted. Price data not yet available at publication is indicated with 00.00% or -100.00%. Please note that distributions are not included in the current momentum numbers.
If the TTI is above the trend line, you can use the tables in the link below to pick your winners:
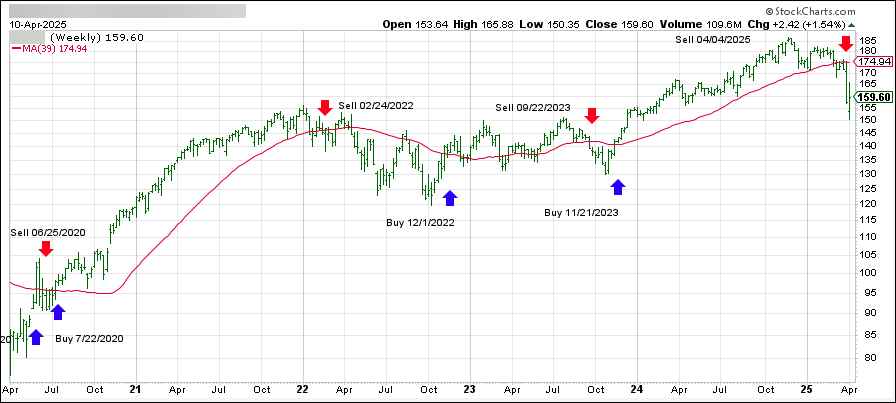
This is our global guide, the International Trend Tracking Index (green). It has broken below its long-term trend line (red) by -4.54% and has now moved into “Sell” mode as of 4/7/2025.
The list in the link below shows the High Volume (HV) International ETFs I track for you during a Buy cycle. They are also ranked by M-Index:
This is the mother of all lists, showing all ETFs I track and how they stack up against each other. The sorting order is by M-Index too. Momentum figures for all ETFs are not adjusted for dividends.
This is where you can find HV ETFs for specific countries or regions that I watch every week. Please note that the data in this table does not include adjustments due to distributions. Country funds can be wild beasts, so make sure you use a trailing stop loss (I use 10%) to protect yourself from nasty bites.
This is where you can diversify your portfolio by looking for different opportunities in various sectors of the market. The table of HV Sector ETFs in the following link covers a wide range of possibilities. The sorting order is by M-Index:
Here too, I recommend using a 10% trailing stop loss to limit your risk.
BOND & DIVIDEND ETFs: SELECTIVE BUY
If you like getting paid for holding ETFs, here’s a list of bond and dividend paying ETFs. But before you buy them, make sure you check their momentum figures first. Then you can visit your favorite financial web site to see their yield and other details.
Please note that the data in this table does not include adjustments due to distributions.
Please note that some of these funds try to beat the index they are tied to by a certain percentage. This can boost your returns, but it can also magnify your losses. So be careful and use a trailing sell stop (I suggest 10%) and be ready for some bumps along the way.
NEW SUBSCRIBER INFORMATION
To get a head start on more successful investing, please click on:
In case you missed it, you can download my latest e-book “How to beat the S&P 500…with the S&P 500,” here. If you are investing your 401k and must use mutual funds, I suggest you mainly stick with the S&P 500 as described in my book. Of course, you can always use the above tables to find sector or country ETFs that suit your taste and use the equivalent mutual funds as offered by your custodian.
Disclosure:
I must tell you that I, as well as my advisory clients, own some of the ETFs listed in the above table. Also, they are not meant to be specific investment recommendations for you, they just show which ETFs from my universe are doing well right now.
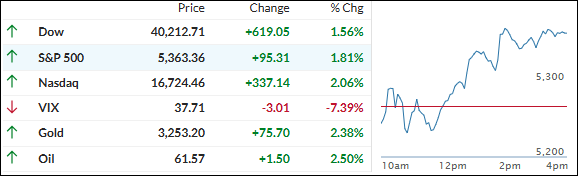
Equities resumed their downward trend after yesterday’s historic rebound, which was triggered by Trump’s 90-day pause on some reciprocal tariffs. The EU followed suit by announcing a similar pause on U.S. goods.
Despite this, a 125% tariff rate on goods from China remains, with Trump expressing optimism that “a very good deal” can still be achieved. However, the markets may not be out of the woods yet. While the delay might provide some relief, it does not reduce uncertainty, and market volatility is expected to remain high.
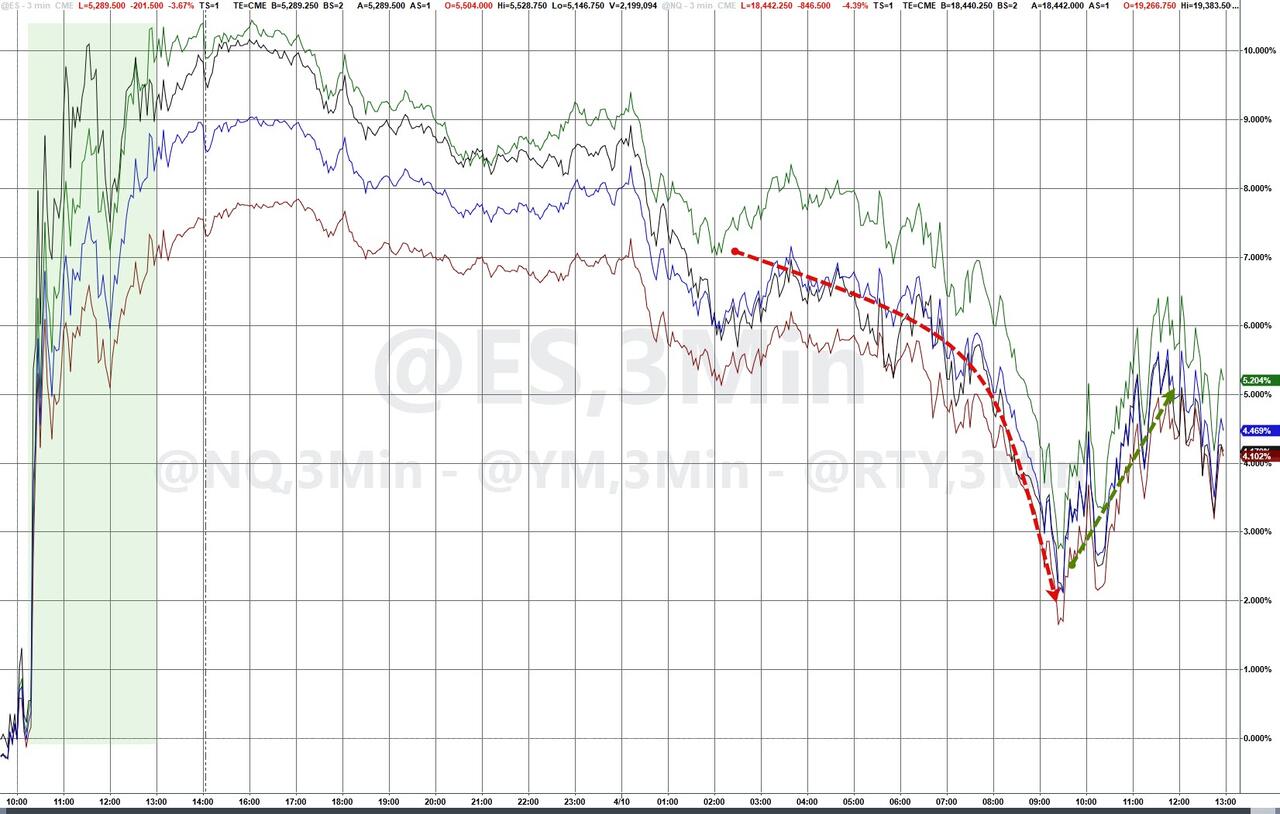
This morning, the tech sector experienced the steepest declines, with major players like Apple, Tesla, Nvidia, and Meta pulling back sharply. This follows the S&P 500’s 9% gain yesterday, its third-largest single-day increase since World War II.
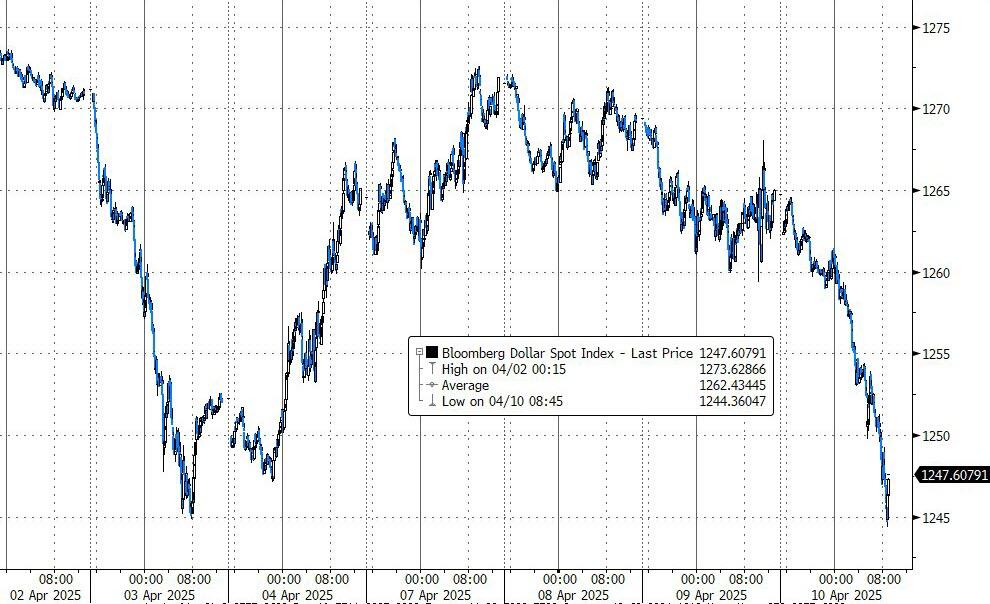
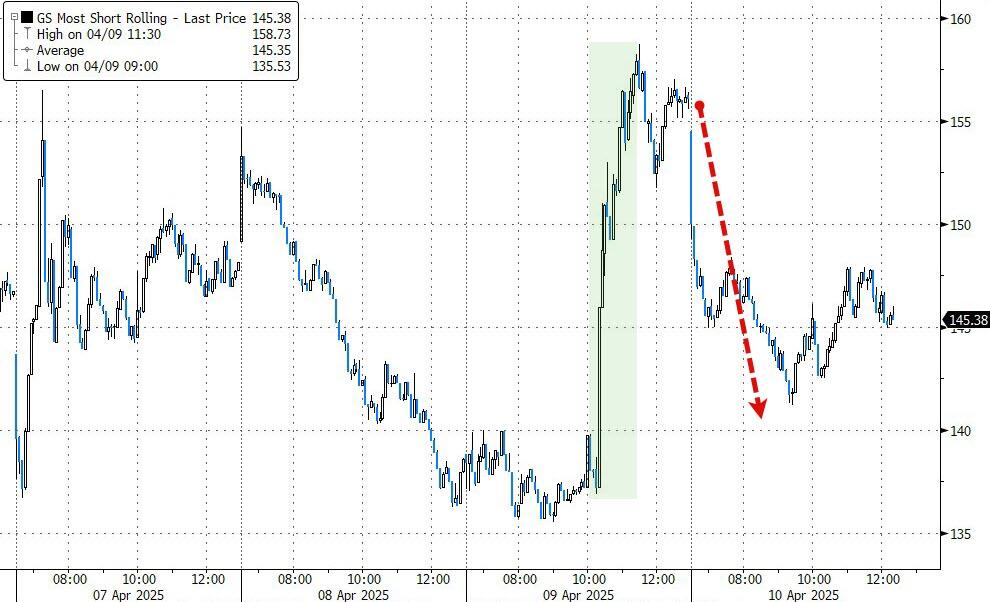
The major indexes retraced more than half of yesterday’s gains before cutting losses somewhat by midday, as the dollar weakened, and yesterday’s short squeeze showed no follow-through.
Global uncertainty pushed gold prices to a record high, marking its biggest two-day gain since the COVID-19 pandemic. Conversely, Bitcoin gave up some of yesterday’s gains but managed to retake the $80k level, while bond yields closed higher.
This period of uncertainty, volatility, and confusion is underscored by the dollar being at its lowest in two years, while gold sits at a record level.
This is a good time to watch this debacle from the sidelines.
