
- Moving the markets
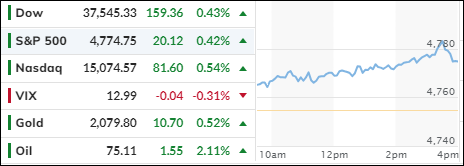
The stock market kept up its momentum from last week and kicked off the final week of the year with a bang. The S&P 500 edged closer to its all-time high, as investors shrugged off the holiday blues and low trading volume.
The upbeat mood was fueled by signs of easing inflation, which is getting closer to the Fed’s 2% goal. This also raised hopes of interest rate cuts in 2020, which would be music to the ears of many traders. Some are calling this a “goldilocks” scenario, where everything is just right: low inflation, steady growth, and no more rate hikes.
The optimism was supported by some solid economic data, including rising home prices, a strong National Activity index, and a positive Fed Manufacturing index. These indicators helped lift the US Surprise index, which measures how the economy is performing relative to expectations.
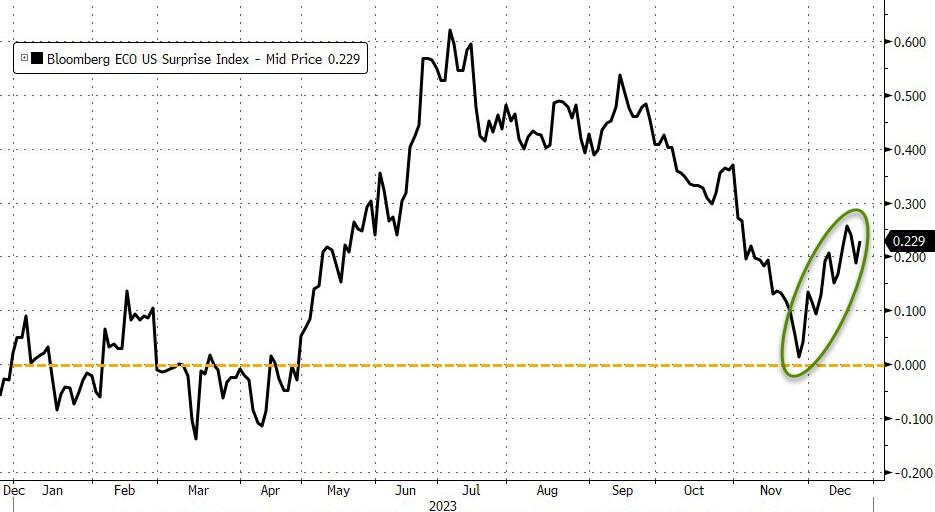
The bulls also got a boost from some short squeezes, which forced bearish traders to cover their bets and push up the prices of some of the most hated stocks. The tech sector also saw some action, as some of the most unprofitable companies soared to new heights. Here’s a chart from ZeroHedge that shows the madness.
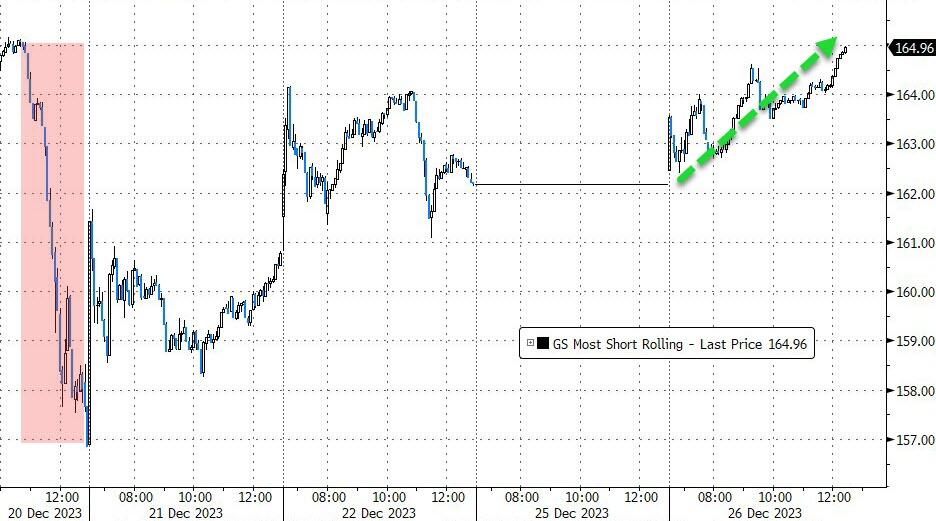
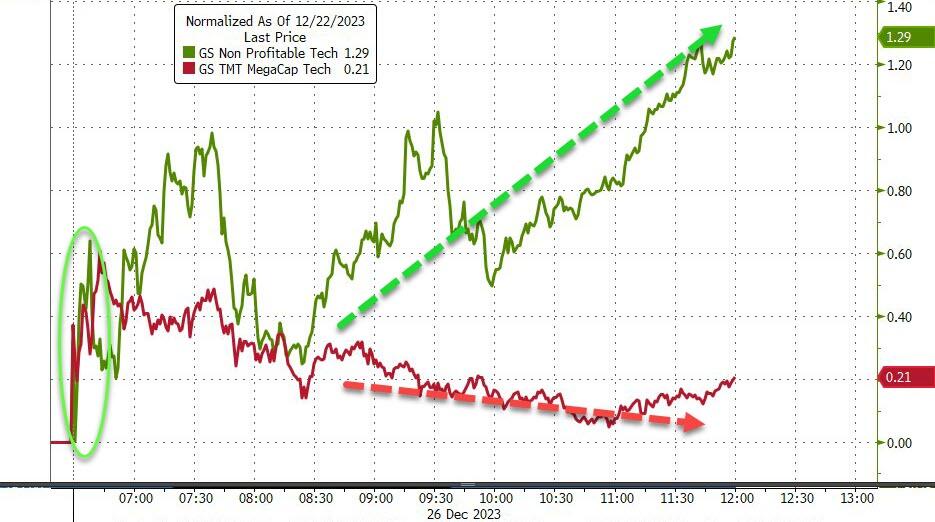
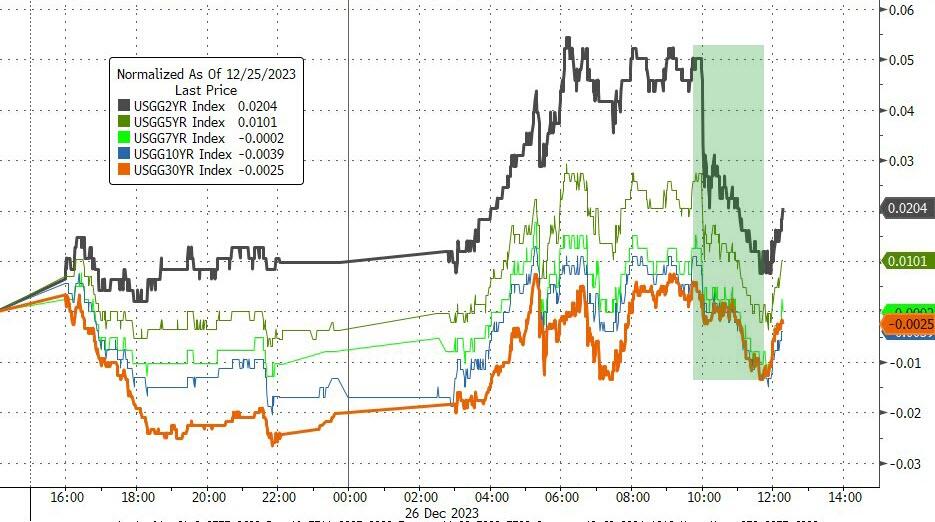
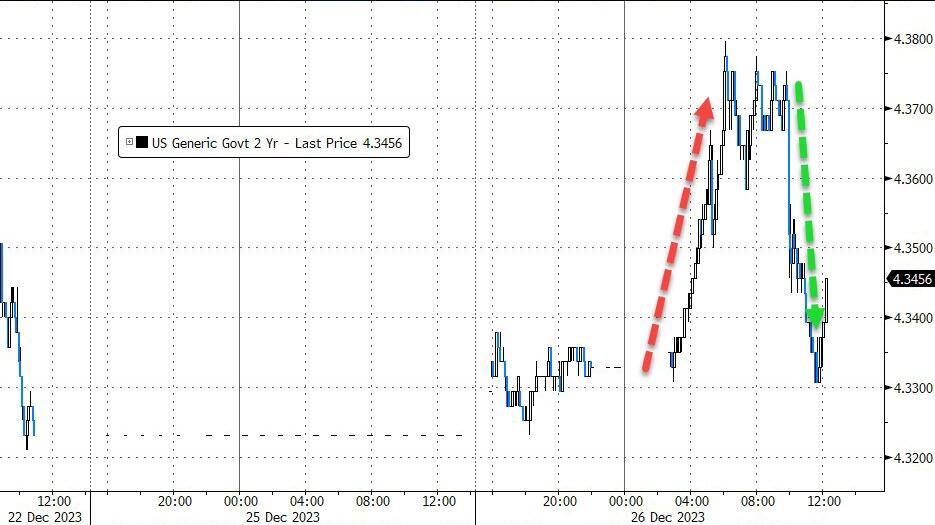
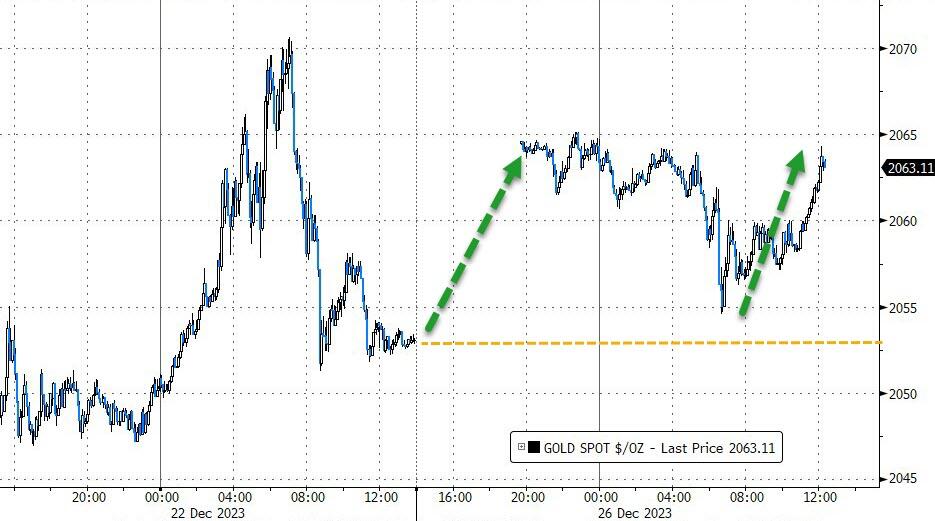
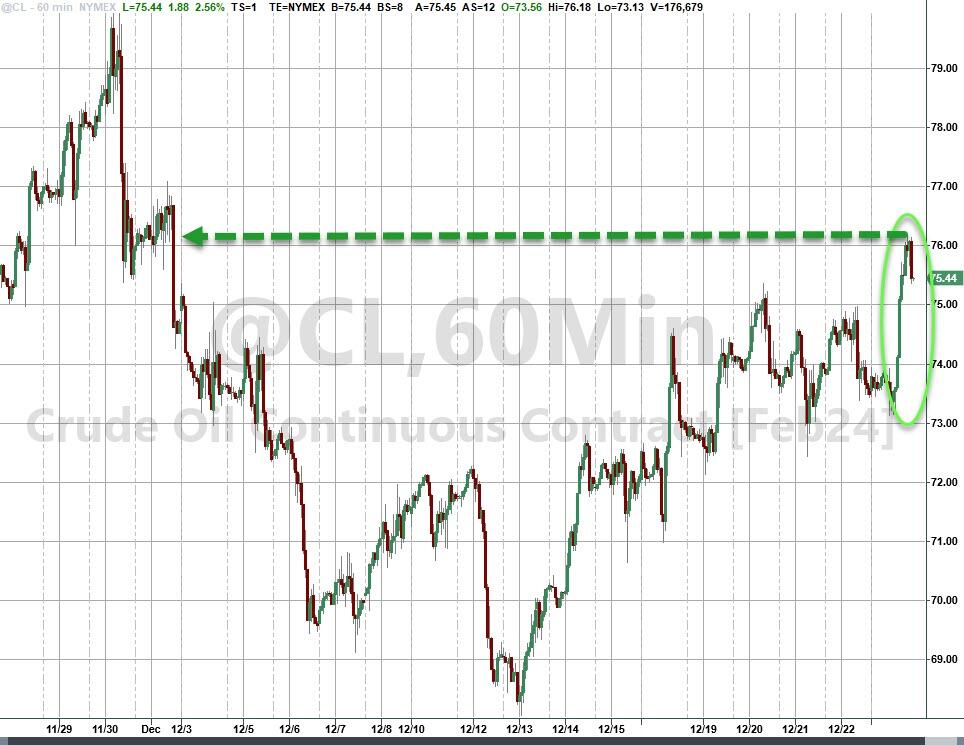
The bond market was relatively calm, with yields staying flat for the day. The 2-year yield had some wild swings, though, as the dollar weakened, and gold regained its shine above $2,070. Oil prices also jumped back above $75, as supply concerns outweighed demand worries.
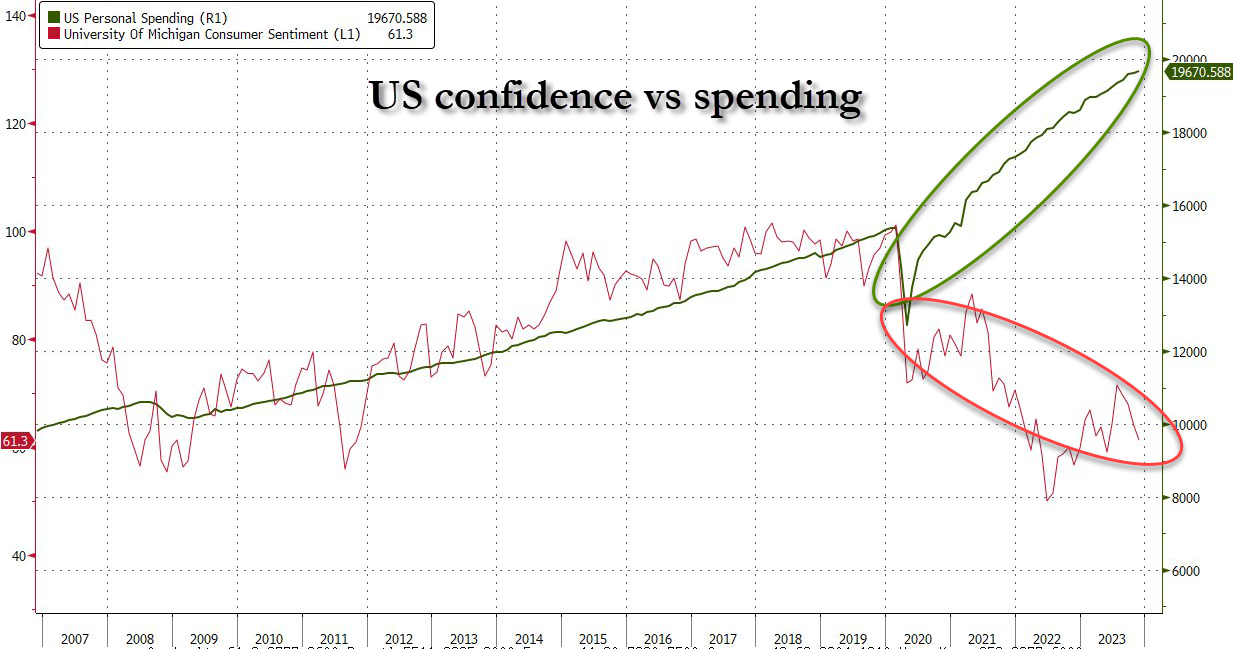
The only sour note in the economic data was a drop in consumer confidence, which contrasted with a rise in personal spending. Apparently, Americans are racking up $1 trillion in credit card debt to buy things they don’t really need or want or, are they in survival mode?
How long can this go on?
2. Current “Buy” Cycles (effective 11/21/2023)
Our Trend Tracking Indexes (TTIs) have both crossed their trend lines with enough strength to trigger new “Buy” signals. That means, Tuesday, 11/21/2023, was the official date for these signals.
If you want to follow our strategy, you should first decide how much you want to invest based on your risk tolerance (percentage of allocation). Then, you should check my Thursday StatSheet and Saturday’s “ETFs on the Cutline” report for suitable ETFs to buy.
3. Trend Tracking Indexes (TTIs)
The market was stable and positive today, with the major indexes staying above their previous levels and the S&P 500 approaching new record highs.
Our TTIs followed the market trend and ended the day deeper on the bullish side of their respective trend lines.
This is how we closed 12/26/2023:
Domestic TTI: +8.90% above its M/A (prior close +8.28%)—Buy signal effective 11/21/2023.
International TTI: +6.99% above its M/A (prior close +6.57%)—Buy signal effective 11/21/2023.
All linked charts above are courtesy of Bloomberg via ZeroHedge.
Contact Ulli