
ETF Tracker StatSheet
You can view the latest version here.
MARKETS MIXED AS INFLATION SLOWS, INCOME DIVERGES, AND RATE CUTS LOOM
- Moving the markets
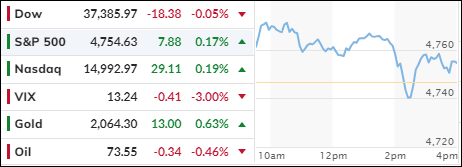
The S&P and Nasdaq managed to squeeze out a tiny gain, thanks to tame inflation data, and extended their weekly winning streak to eight. The Dow was not so lucky and ended in the red.
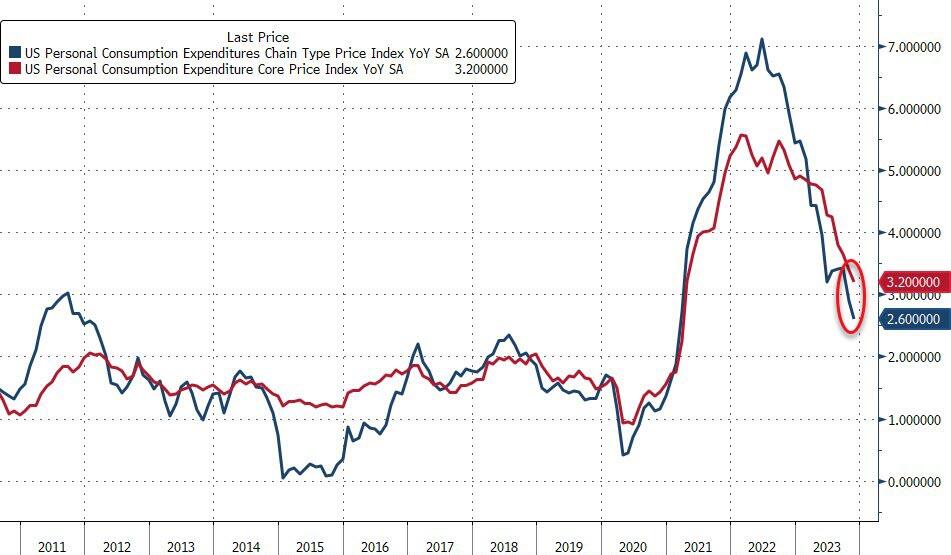
The latest inflation report showed that prices rose less than expected in November. The core PCE index, which the Fed watches closely, increased by 0.1% from the previous month and 3.2% from a year ago, matching the forecasts. Economists had predicted a 0.1% monthly rise and a 3.3% annual gain.
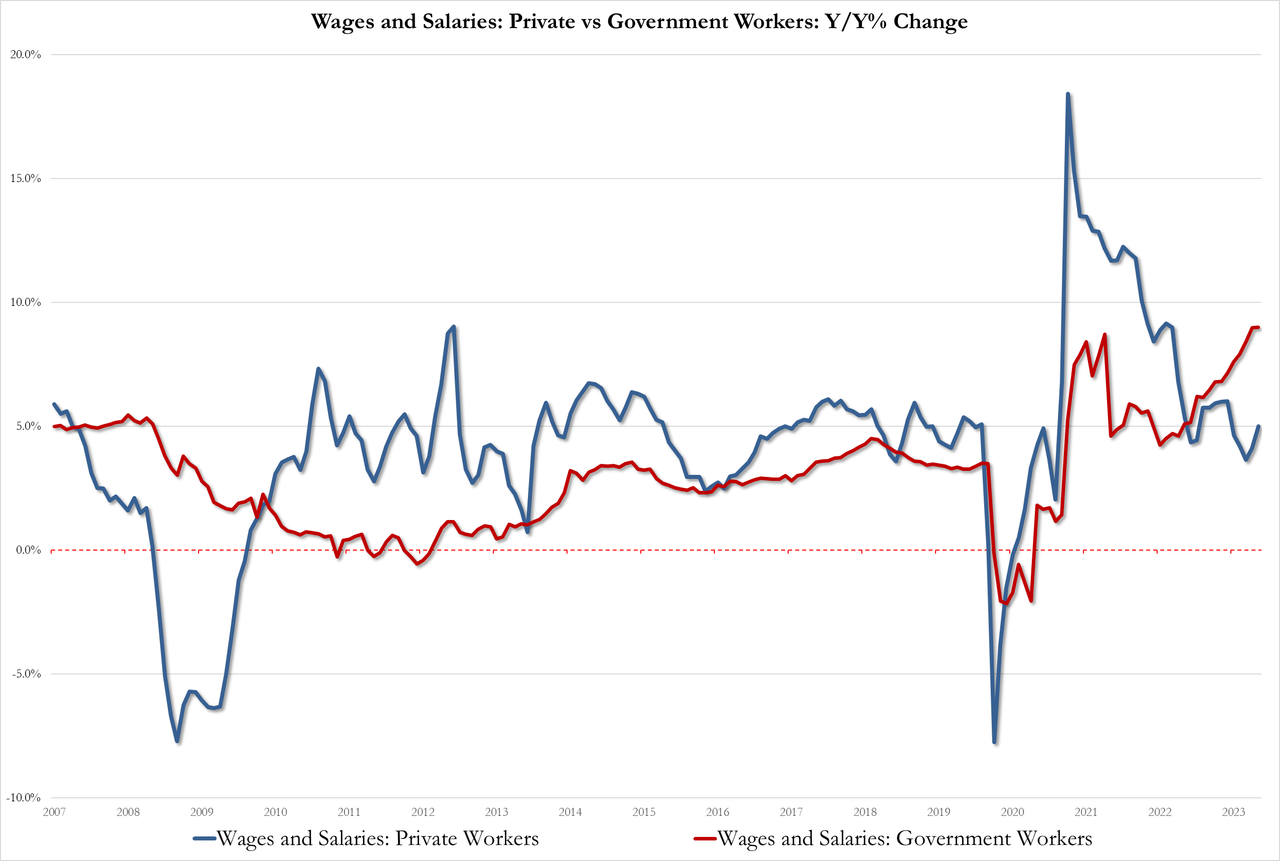
On the income front, private sector workers saw their wages grow by 5.0% year-over-year, after a sluggish 4.1% in October, which was the lowest in three years. Meanwhile, government workers enjoyed a whopping 9.0% year-over-year increase, tying a record high. Something seems fishy here…
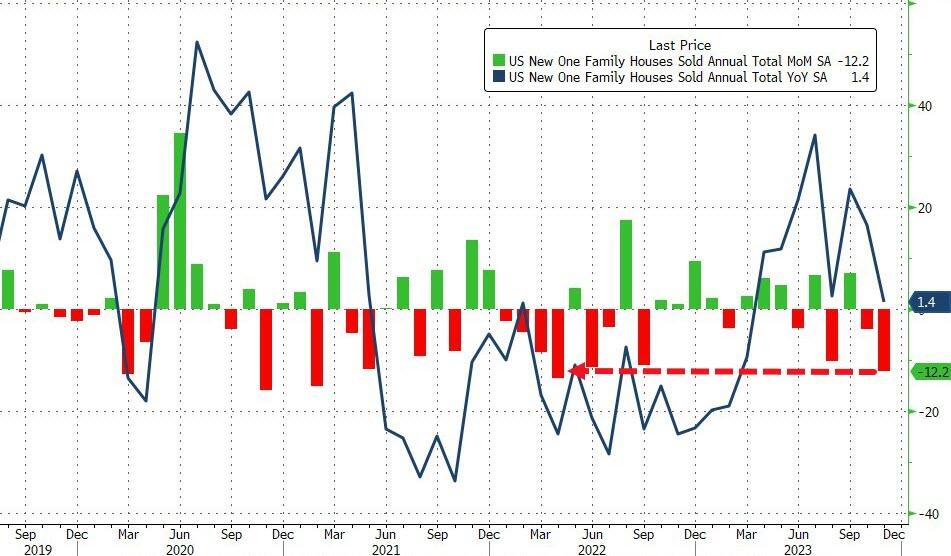
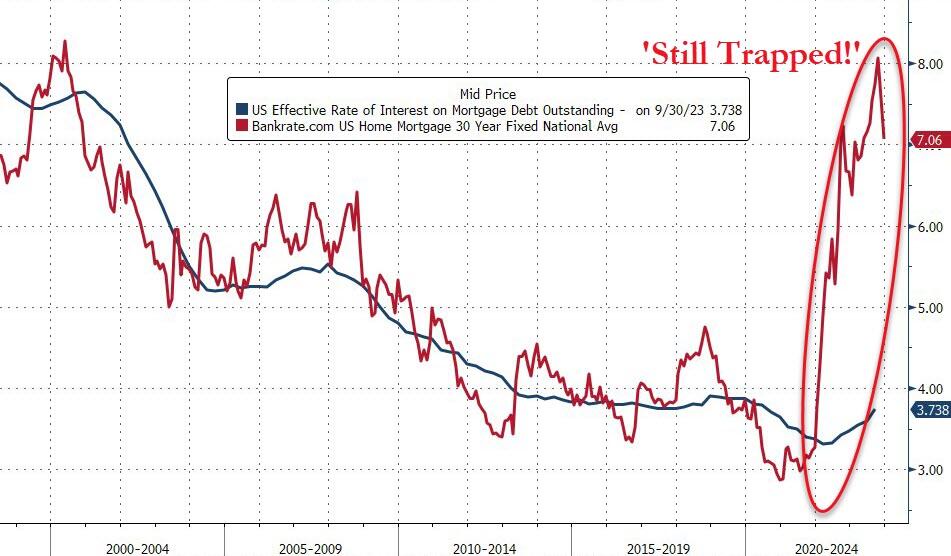
US new home sales plummeted 12.2% in November, despite lower mortgage rates, but existing home sales bounced back slightly from record lows. However, the average mortgage rate for new borrowers is still much higher than the effective rate for all homeowners.
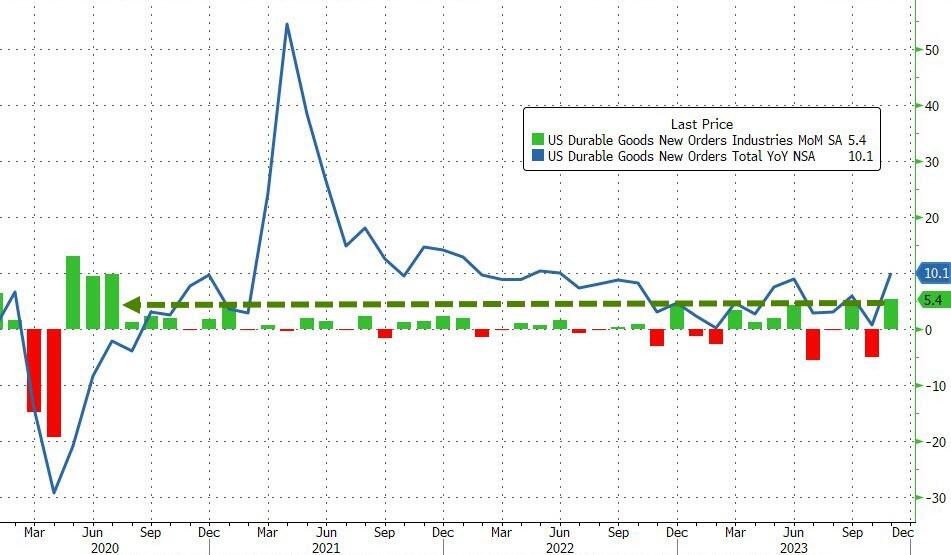
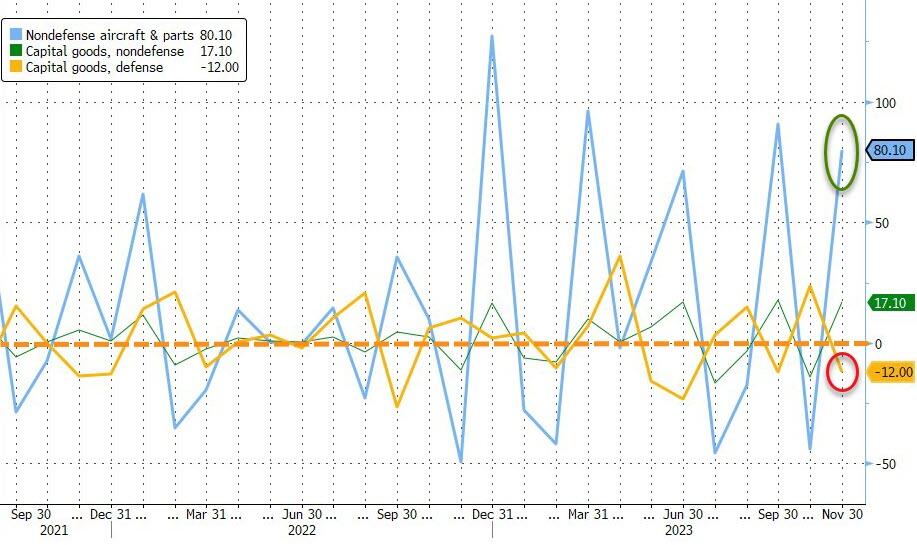
On the bright side, US durable goods orders jumped the most since July 2020, but it’s been a wild ride. The jump in orders was mainly driven by an 80.1% monthly surge in non-defense aircraft and parts orders.
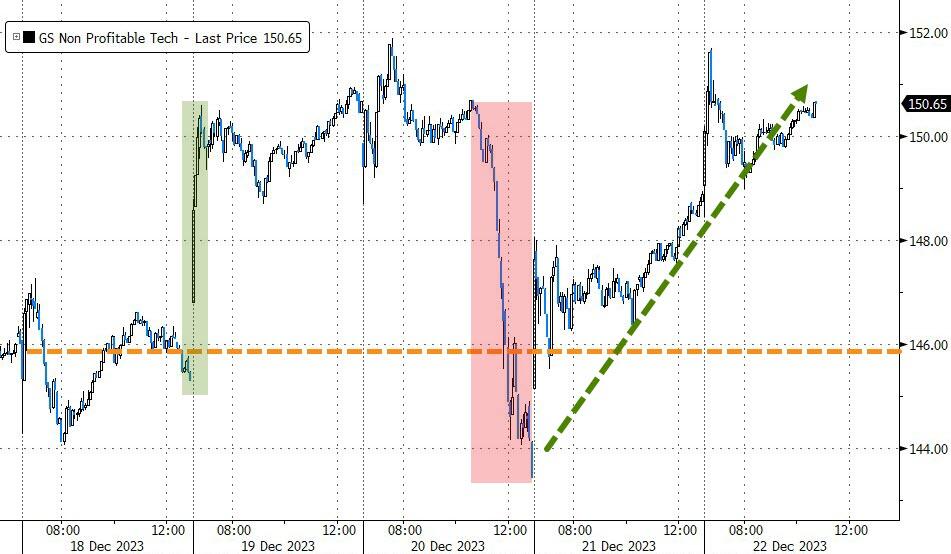
Unprofitable tech stocks soared this week, as heavily shorted stocks were squeezed at the open every day. We also saw some strange macro data, which caused the Citi Economic Surprise index to stall, as financial conditions kept easing.
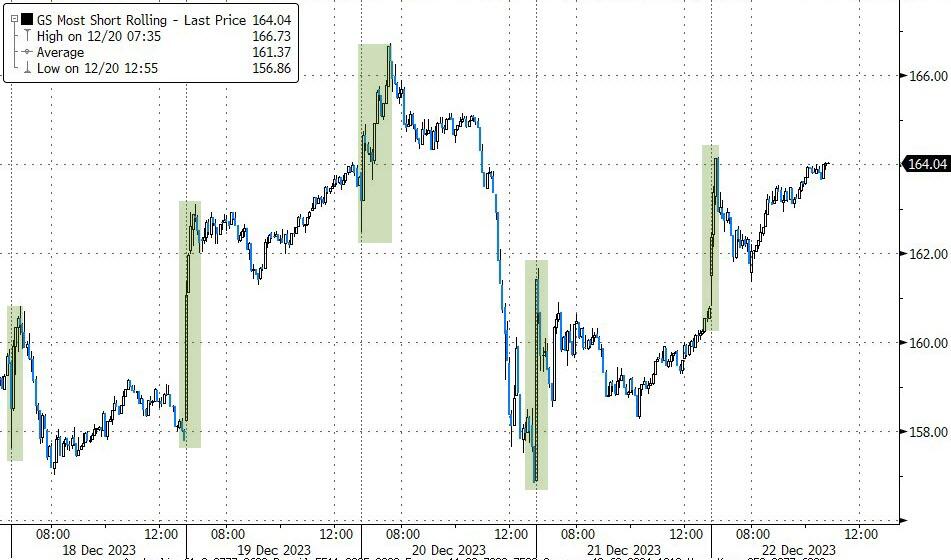
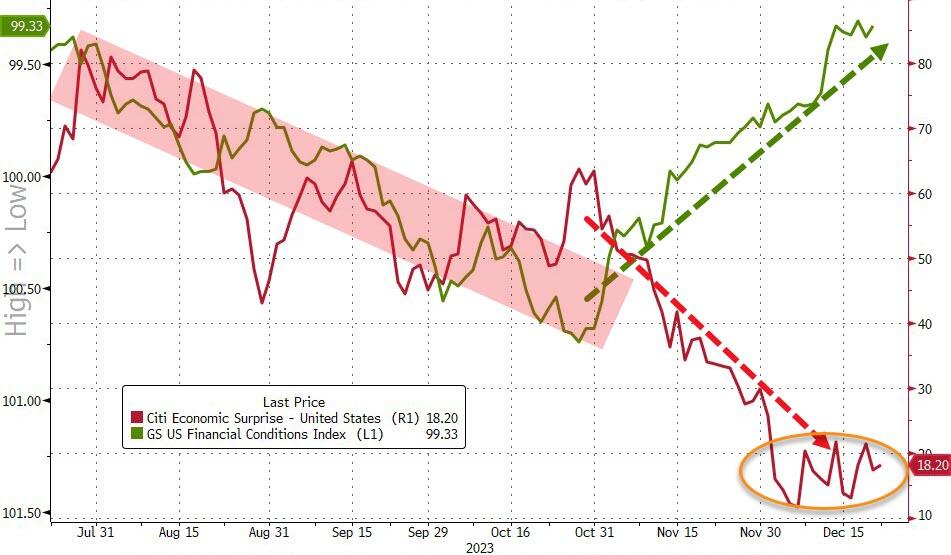
Rate-cut expectations reached a new high this week, now pricing in 163 basis points of cuts in 2024. As ZeroHedge noted, if the Fed needs to slash rates that much, that fast, it won’t be because of cooling inflation – it will be because of worsening depression… which is not good for stocks.
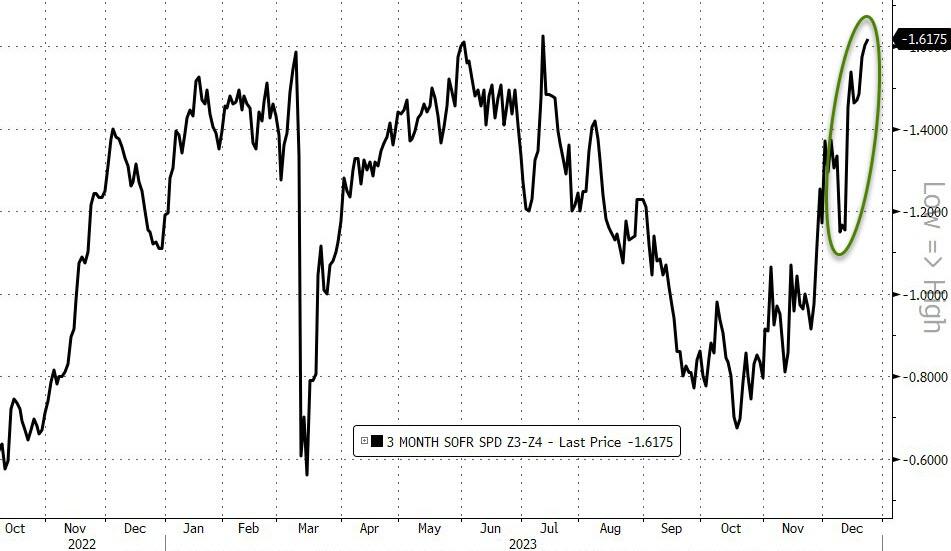
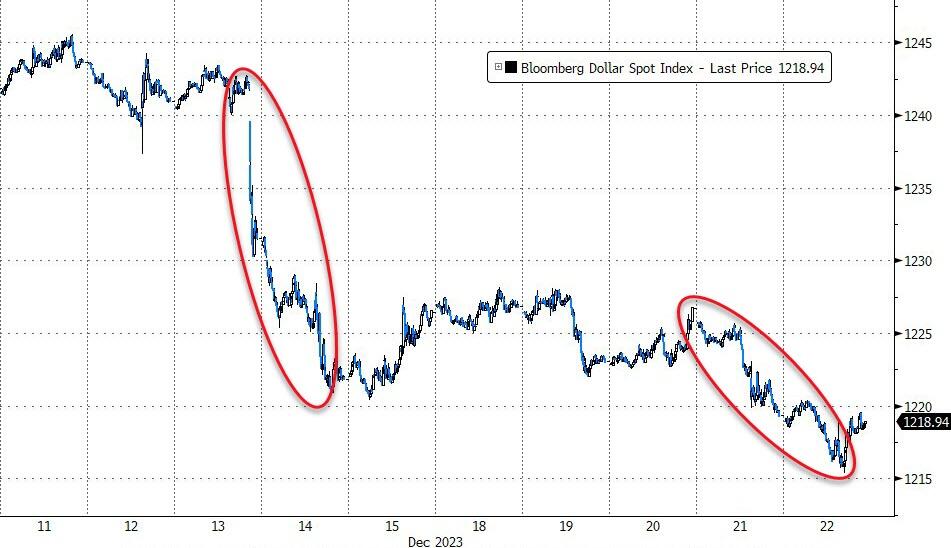
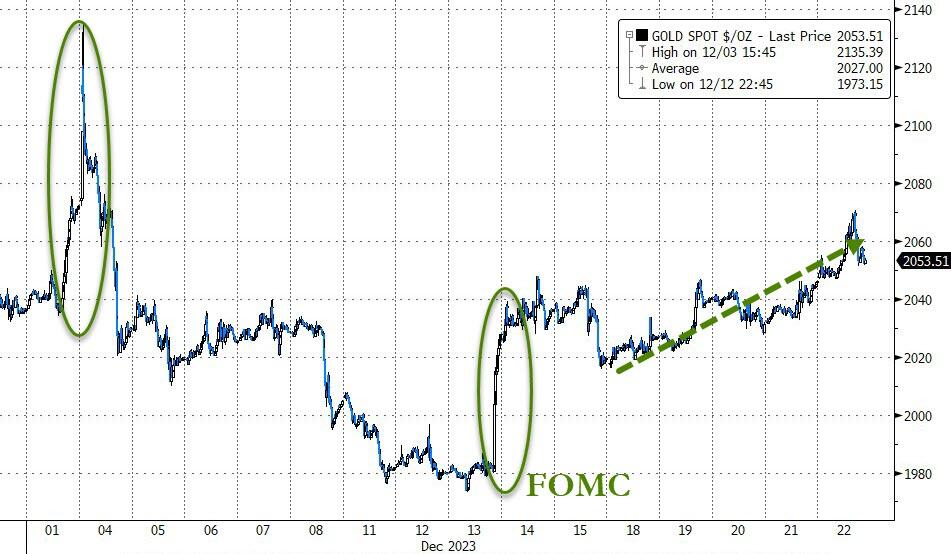
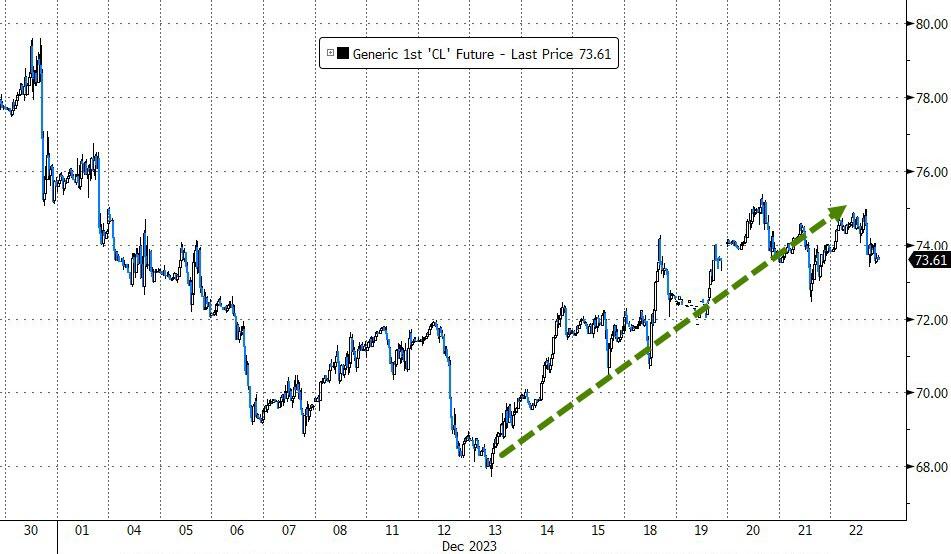
Bond yields were mixed, the dollar fell to its lowest since July and is now down for the 5th week in the last 6. That helped gold, which is up 4 of the last 5 days and rising for the 5th week of the last 6. Oil followed suit and rose for the second week in a row.
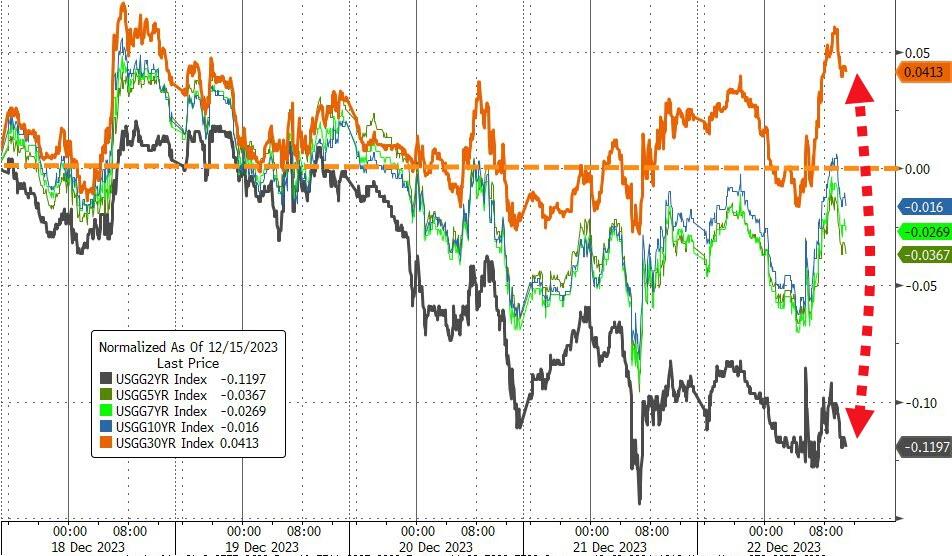
I will be back next Tuesday for the market report.
Merry Christmas!
2. Current “Buy” Cycles (effective 11/21/2023)
Our Trend Tracking Indexes (TTIs) have both crossed their trend lines with enough strength to trigger new “Buy” signals. That means, Tuesday, 11/21/2023, was the official date for these signals.
If you want to follow our strategy, you should first decide how much you want to invest based on your risk tolerance (percentage of allocation). Then, you should check my Thursday StatSheet and Saturday’s “ETFs on the Cutline” report for suitable ETFs to buy.
3. Trend Tracking Indexes (TTIs)
The market was volatile today, with only two of the three major indexes managing to end slightly higher. Our TTIs diverged, as the domestic one improved while the international one declined slightly.
This is how we closed 12/22/2023:
Domestic TTI: +8.28% above its M/A (prior close +7.89%)—Buy signal effective 11/21/2023.
International TTI: +6.57% above its M/A (prior close +6.95%)—Buy signal effective 11/21/2023.
All linked charts above are courtesy of Bloomberg via ZeroHedge.
———————————————————-
WOULD YOU LIKE TO HAVE YOUR INVESTMENTS PROFESSIONALLY MANAGED?
Do you have the time to follow our investment plans yourself? If you are a busy professional who would like to have his portfolio managed using our methodology, please contact me directly to get more details.
Contact Ulli