
- Moving the markets
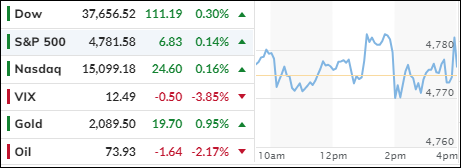
The major indexes barely budged from their flat lines, as the S&P 500 flirted with its all-time high and missed it by a hair.
Traders were itching to see a new record, but they knew it could be followed by a cold shower or a retreat. Stocks were enjoying the “Santa Claus rally,” a festive period that spans the last five trading days of the old year and the first two of the new one. The S&P 500 has averaged a 1.3% gain over this time, based on data from the Stock Trader’s Almanac dating back to 1950.
But not everyone was feeling jolly. Some Wall Street skeptics feared that the market was too giddy, and that the Federal Reserve might spoil the party by delaying rate cuts. The market was betting on a more than 70% chance of a cut at the Fed’s March meeting, but it didn’t help that 90% of stocks in the S&P 500 were trading above their 50-day moving average, indicating a frothy market.
Recent bullish sentiment data also showed signs of euphoria, which could expose investors to nasty surprises. Stocks may have been snoozing, but the session was far from dull.
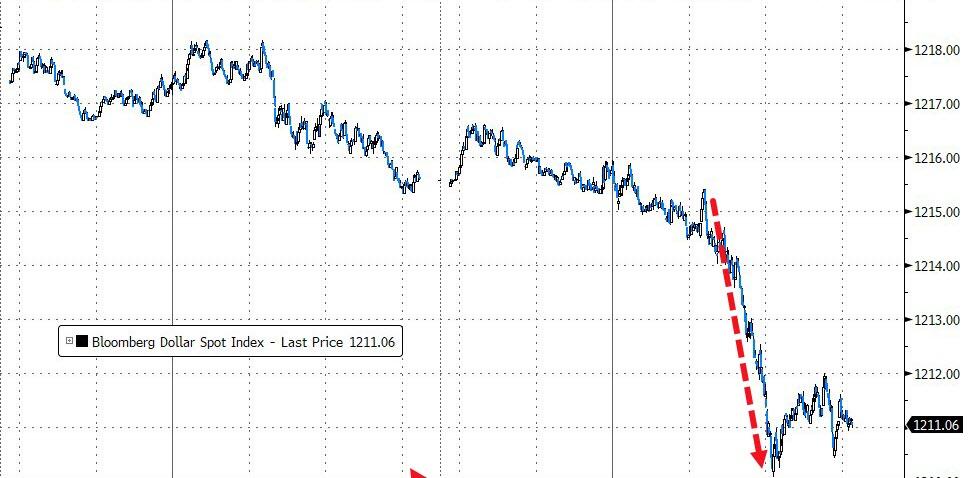
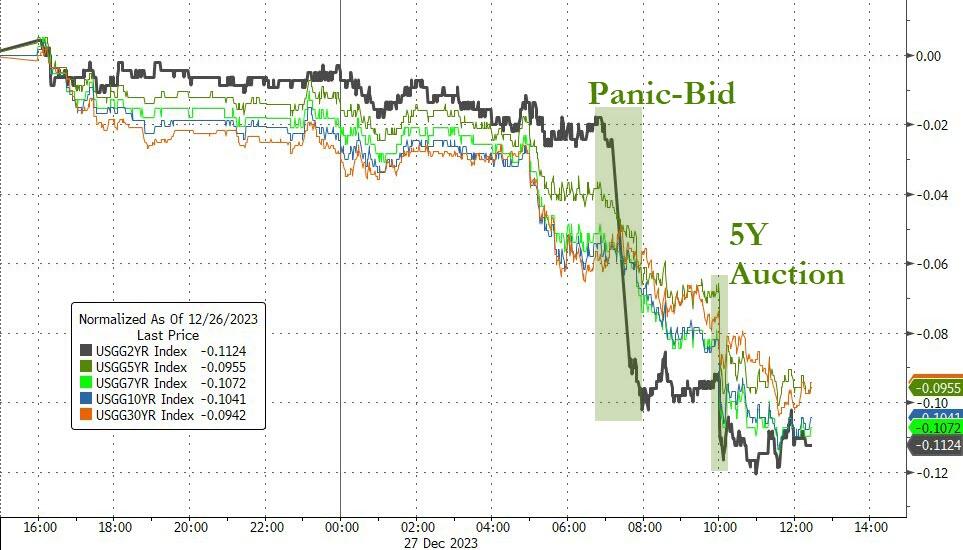
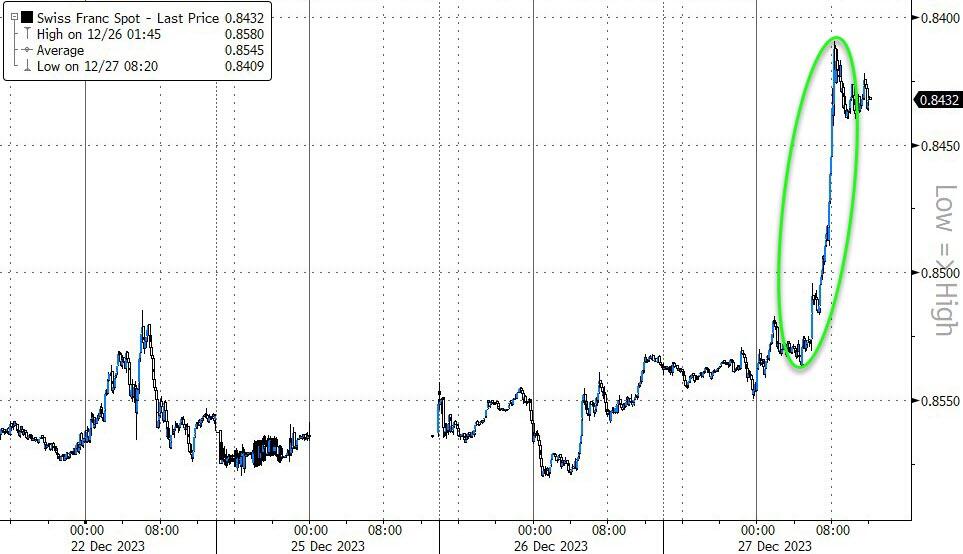
The dollar plunged to its lowest level since July, while bonds, Swiss franc and cryptos soared, and the “Magnificent 7 stocks” got hammered in the morning. The 2-year yield dropped, as money fled to safer assets.
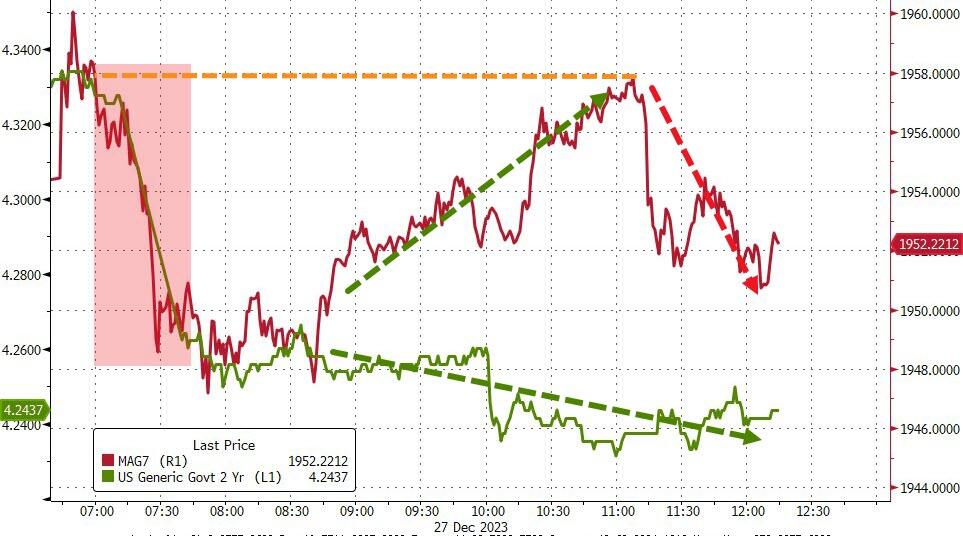
The dollar’s downfall was gold’s glory, with the shiny metal closing at a new record high, signaling more uncertainty and inflation ahead in 2024.
While the Fed’s policy can sway the market, as we’ve seen before, it’s the global liquidity that fuels the fire, even when the fundamentals are weak, as this chart shows.
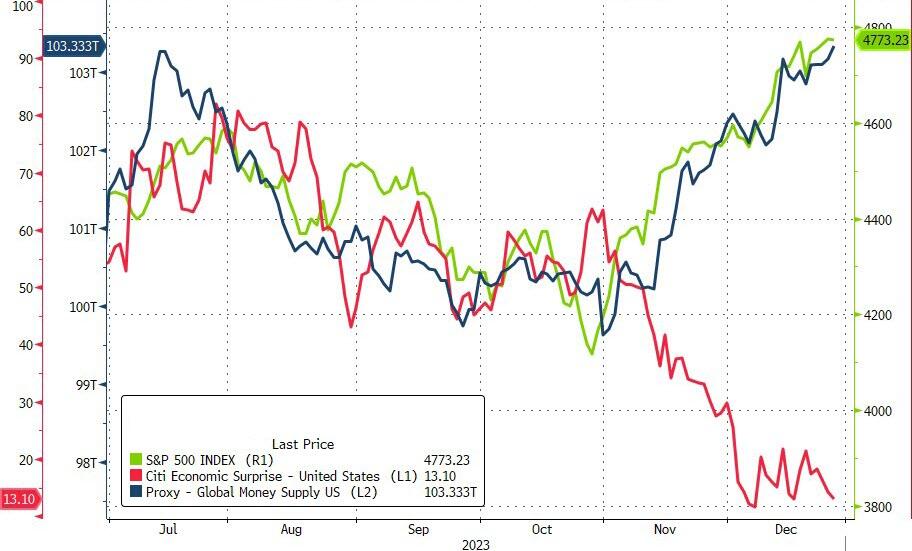
Will the market keep the festive spirit, or will it face a hangover?
2. Current “Buy” Cycles (effective 11/21/2023)
Our Trend Tracking Indexes (TTIs) have both crossed their trend lines with enough strength to trigger new “Buy” signals. That means, Tuesday, 11/21/2023, was the official date for these signals.
If you want to follow our strategy, you should first decide how much you want to invest based on your risk tolerance (percentage of allocation). Then, you should check my Thursday StatSheet and Saturday’s “ETFs on the Cutline” report for suitable ETFs to buy.
3. Trend Tracking Indexes (TTIs)
The major indexes barely rose by the end of the session. Gold, bonds, and the falling dollar were the main drivers of the market.
Despite the sluggish performance, our TTI increased slightly and supported our positive outlook on the market.
This is how we closed 12/27/2023:
Domestic TTI: +9.08% above its M/A (prior close +8.90%)—Buy signal effective 11/21/2023.
International TTI: +7.68% above its M/A (prior close +6.99%)—Buy signal effective 11/21/2023.
All linked charts above are courtesy of Bloomberg via ZeroHedge.
Contact Ulli