
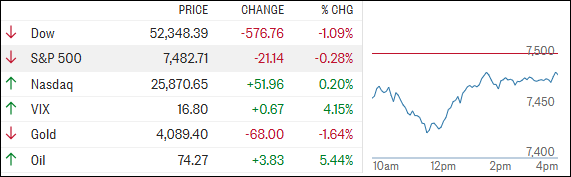
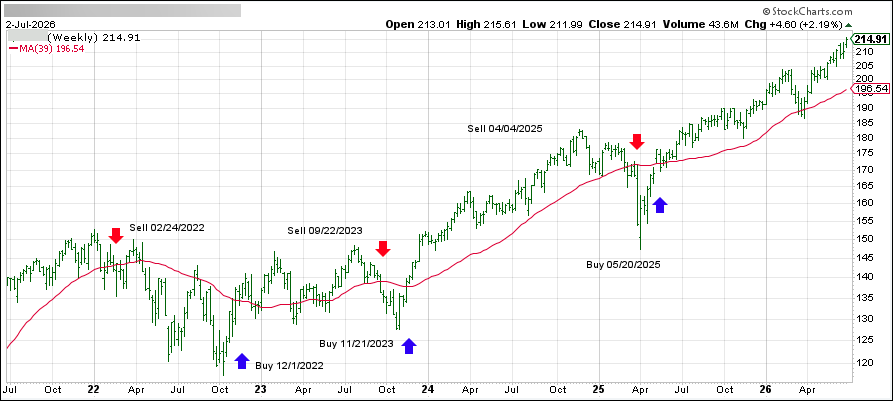
[Chart courtesy of MarketWatch.com]
- Moving the market
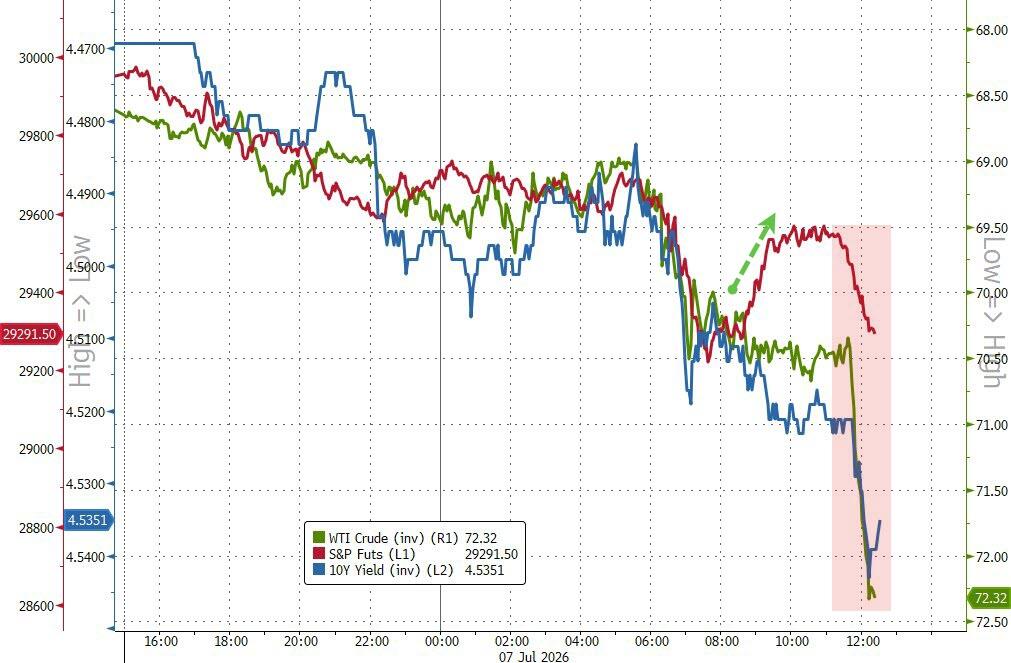
Stocks came under pressure early in the session after President Trump told attendees at the NATO summit that the ceasefire with Iran was effectively over, reigniting concerns about escalating tensions in the Middle East.
The comments sent oil prices sharply higher and sparked a risk-off move across much of the market.
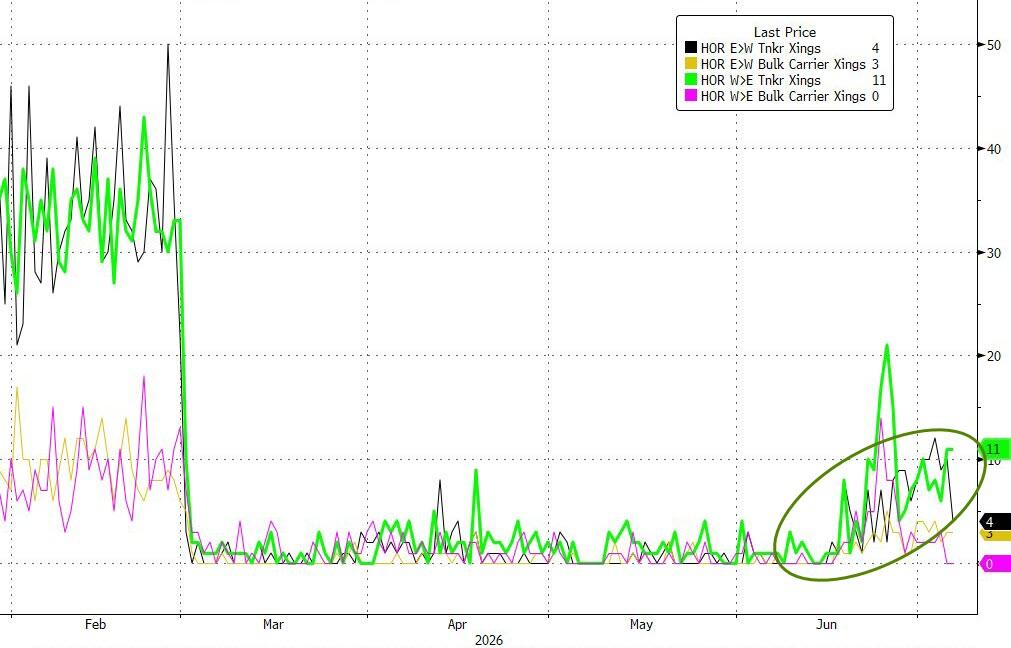
Adding to the unease, Trump later suggested that further military action against Iran could be imminent. His remarks came on the heels of what the U.S. described as a series of powerful strikes against Iranian targets in response to attacks on commercial vessels transiting the Strait of Hormuz.
As oil surged, energy stocks moved higher, while consumer-focused companies, which could be hurt by rising fuel costs, lagged. Chip stocks, meanwhile, found their footing after coming under pressure in the previous session.
The renewed geopolitical tensions disrupted what had become a fairly complacent market narrative. After weeks of optimism surrounding a potential de-escalation in the region, traders suddenly found themselves reevaluating geopolitical risks.
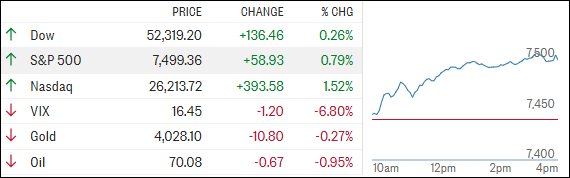
Despite the shaky backdrop, the Nasdaq managed to break away from the broader weakness and finish with a modest gain as dip-buyers stepped in to support the tech sector.
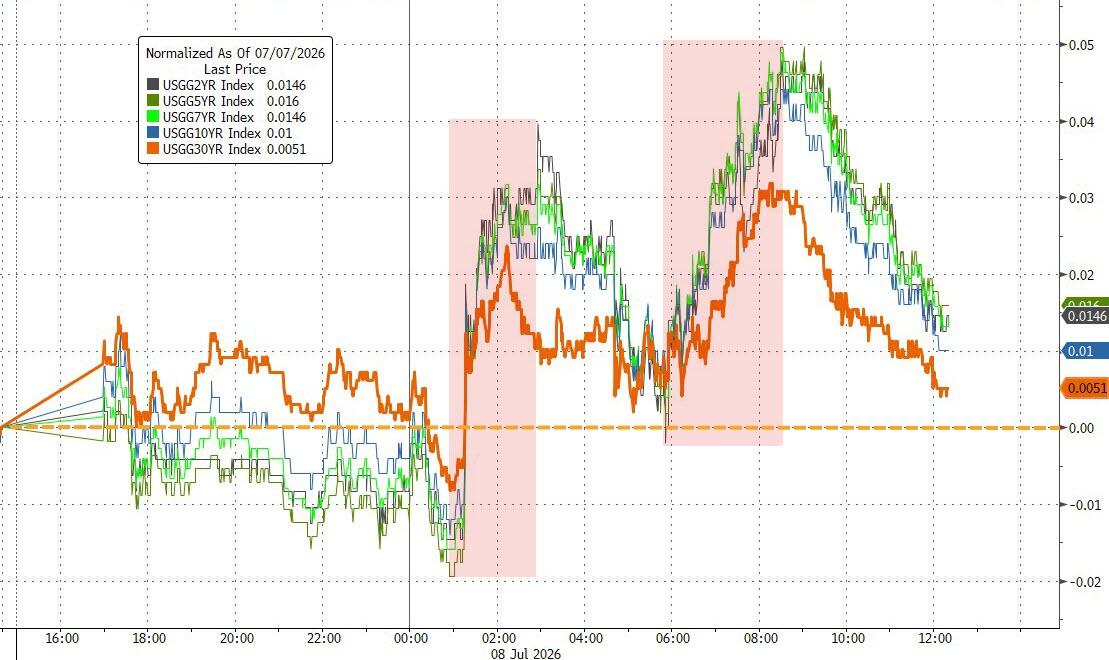
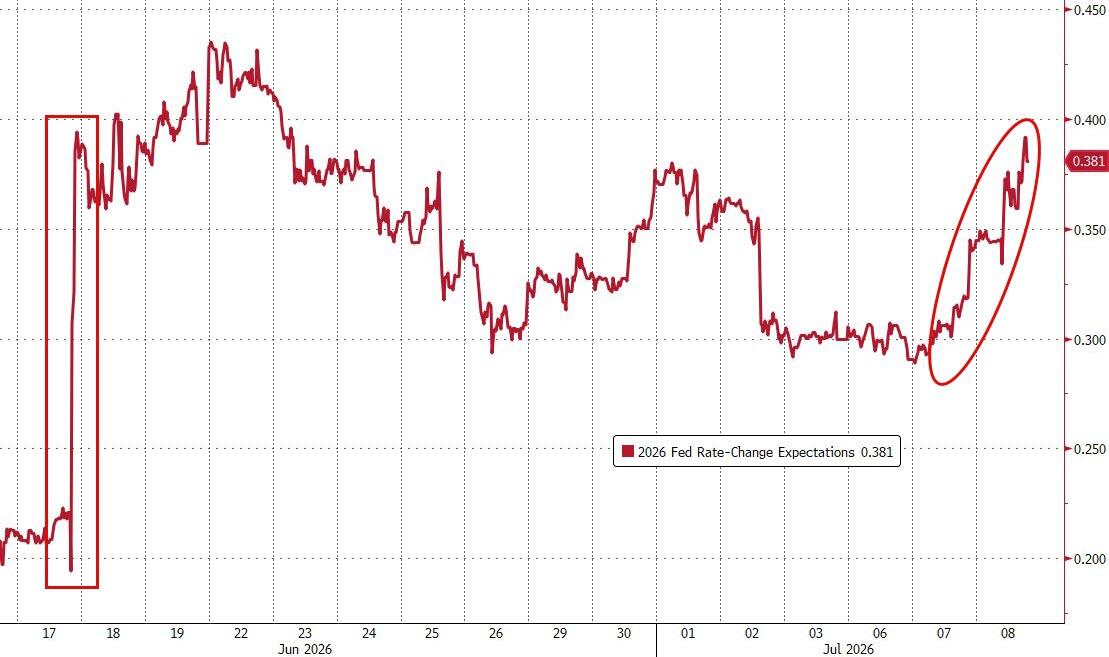
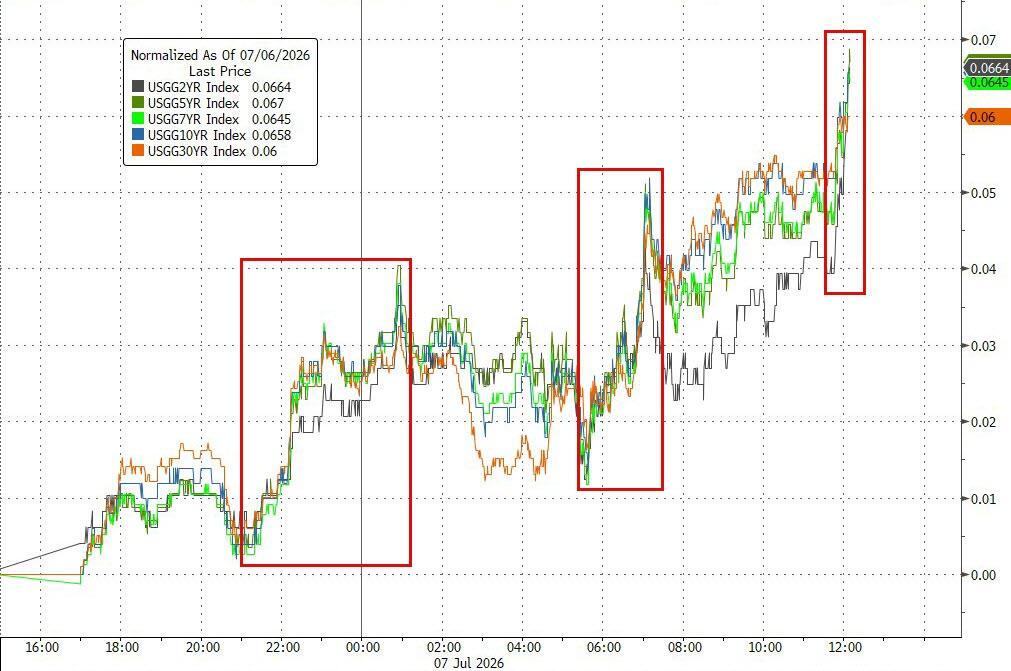
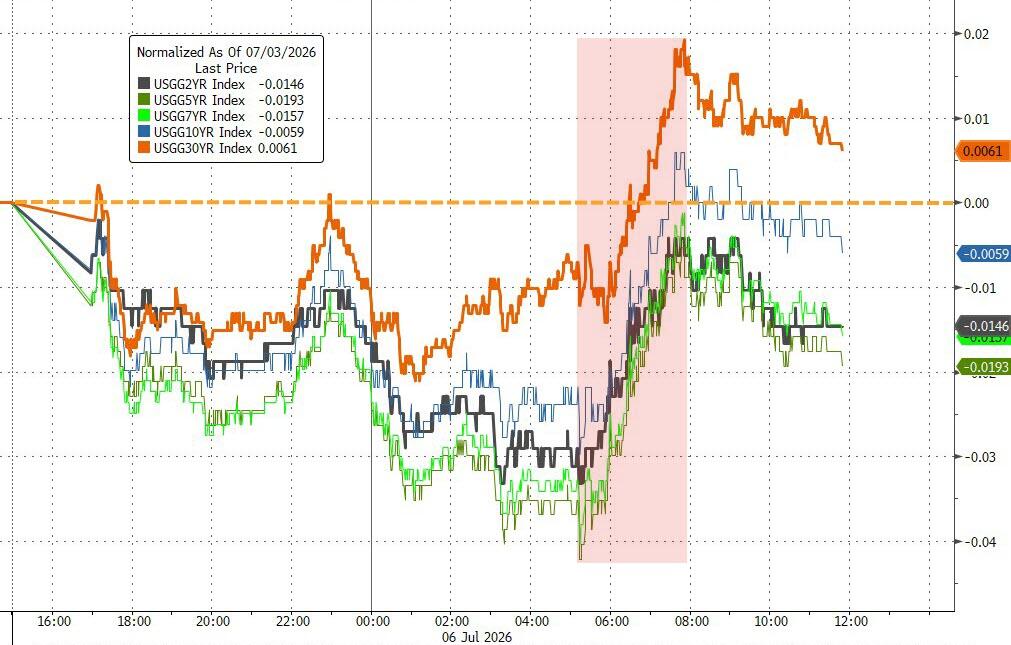
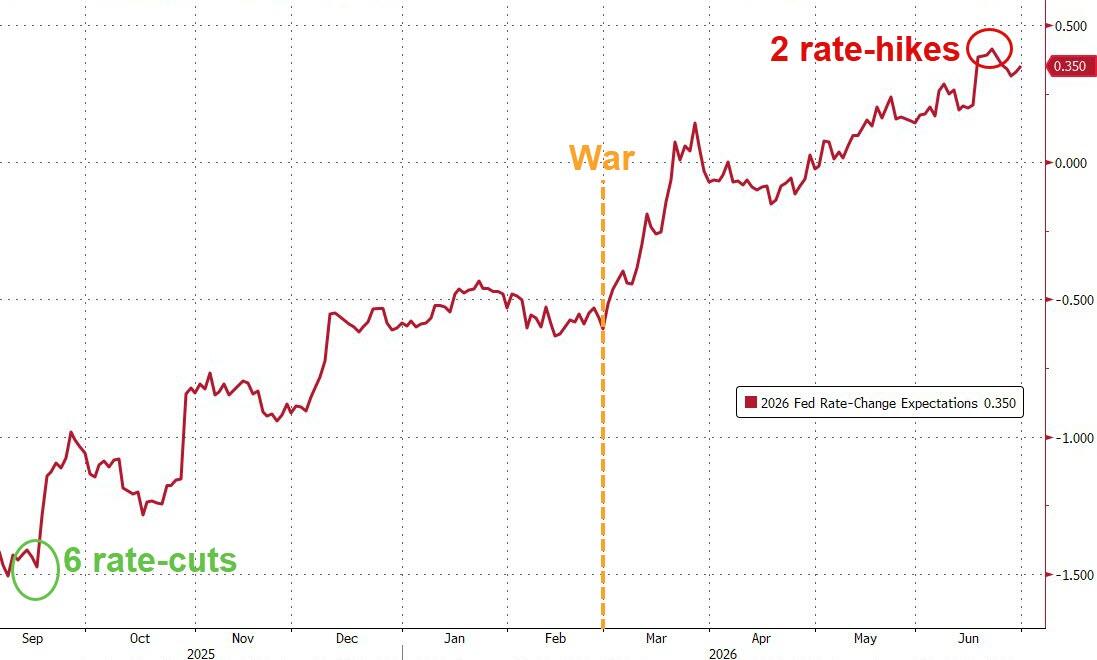
Elsewhere, bond yields moved higher as investors priced in the possibility that rising energy costs could reignite inflationary pressures and keep interest rates elevated for longer.
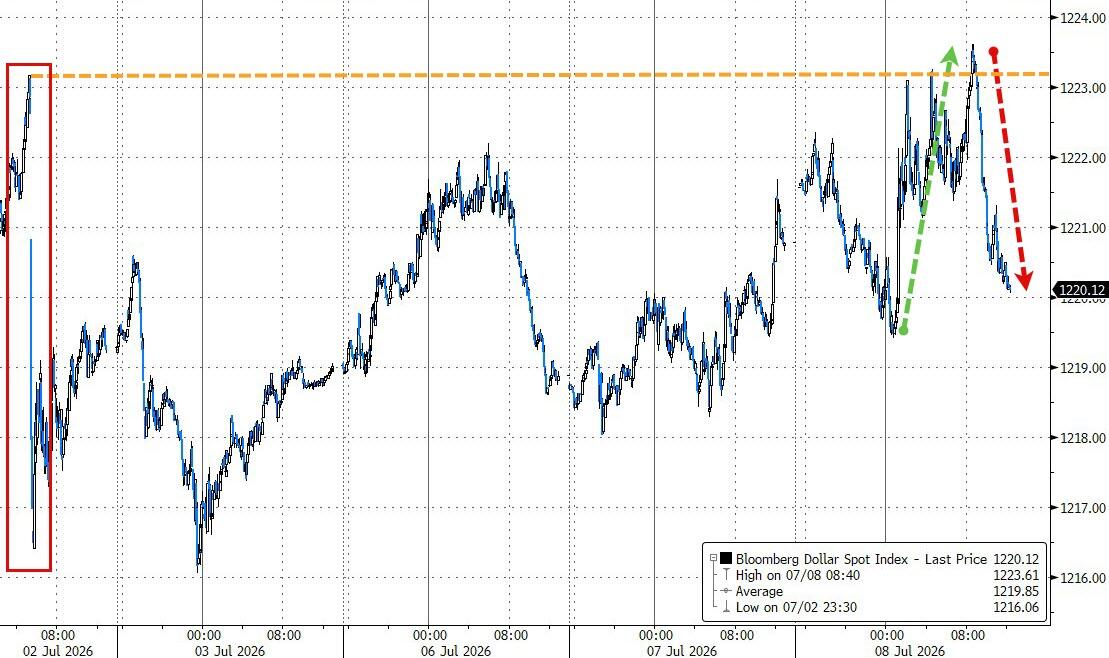
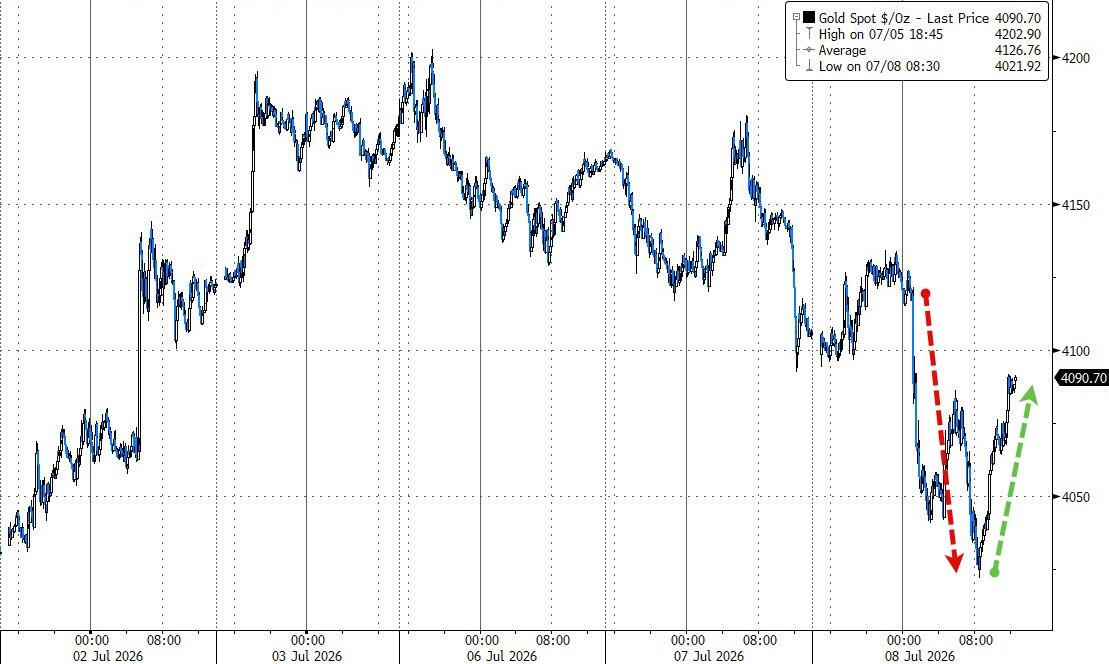
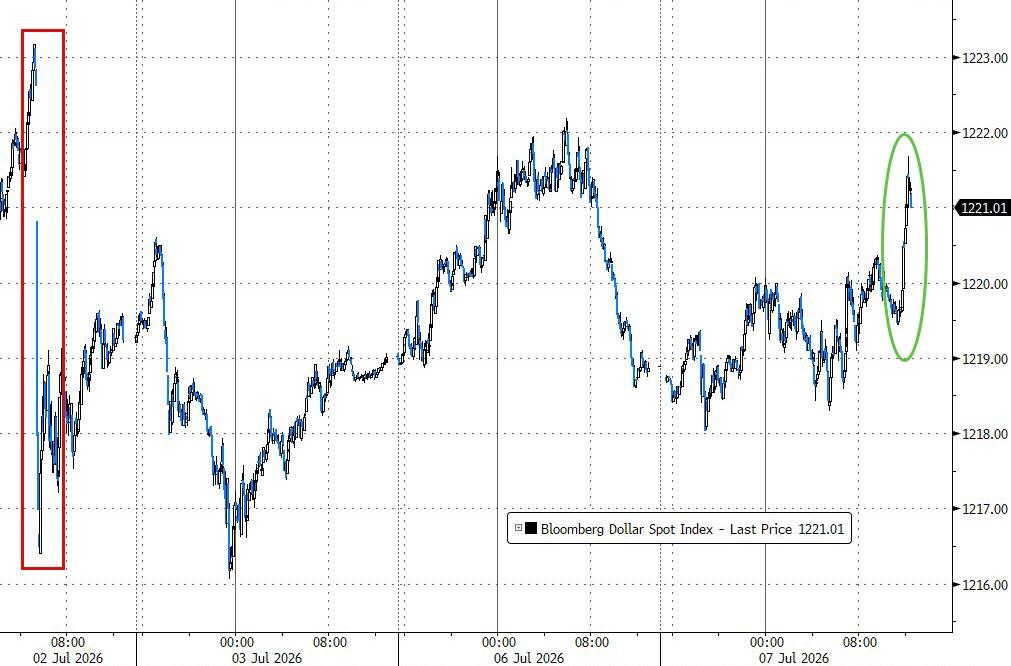
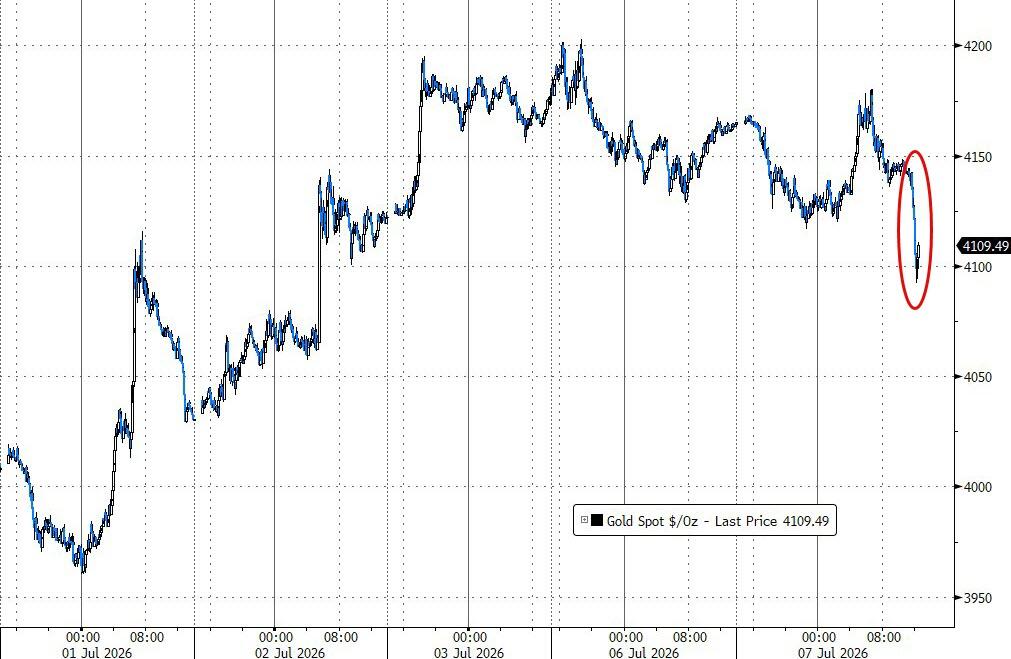
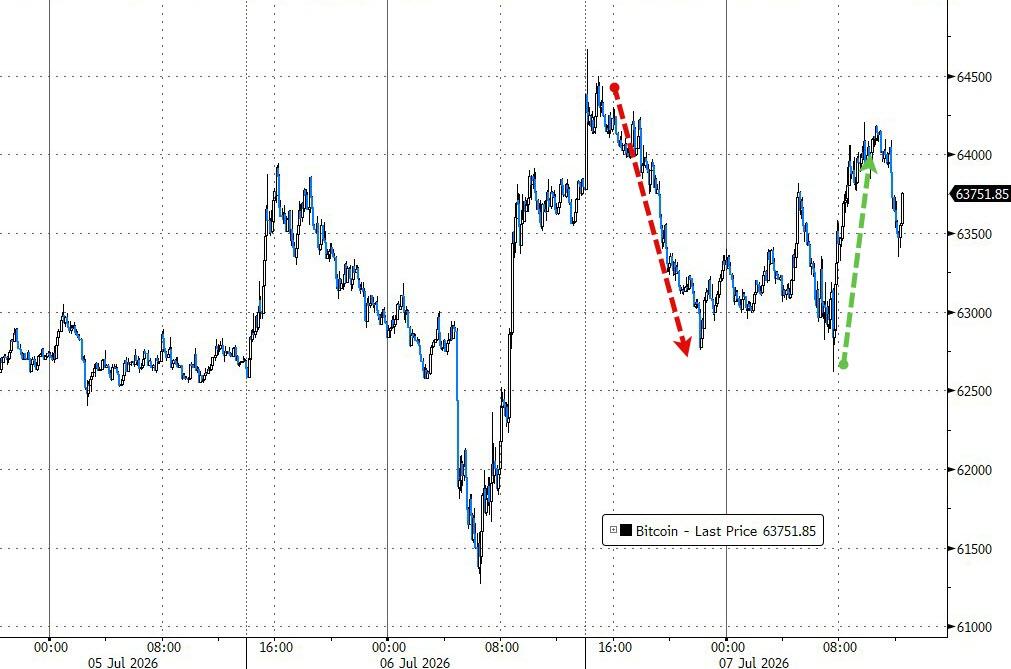
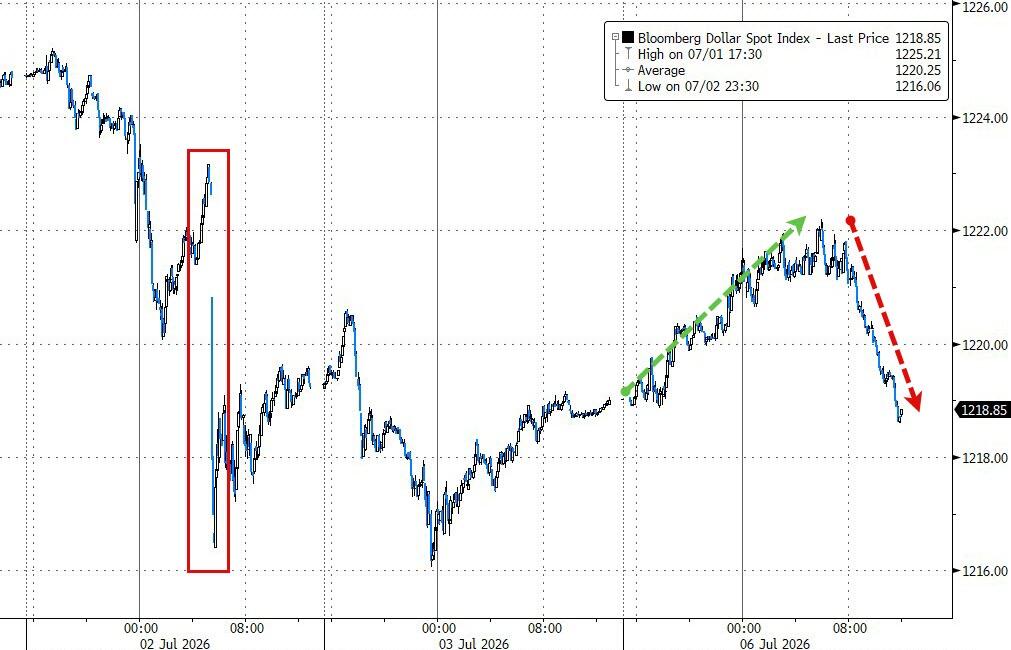
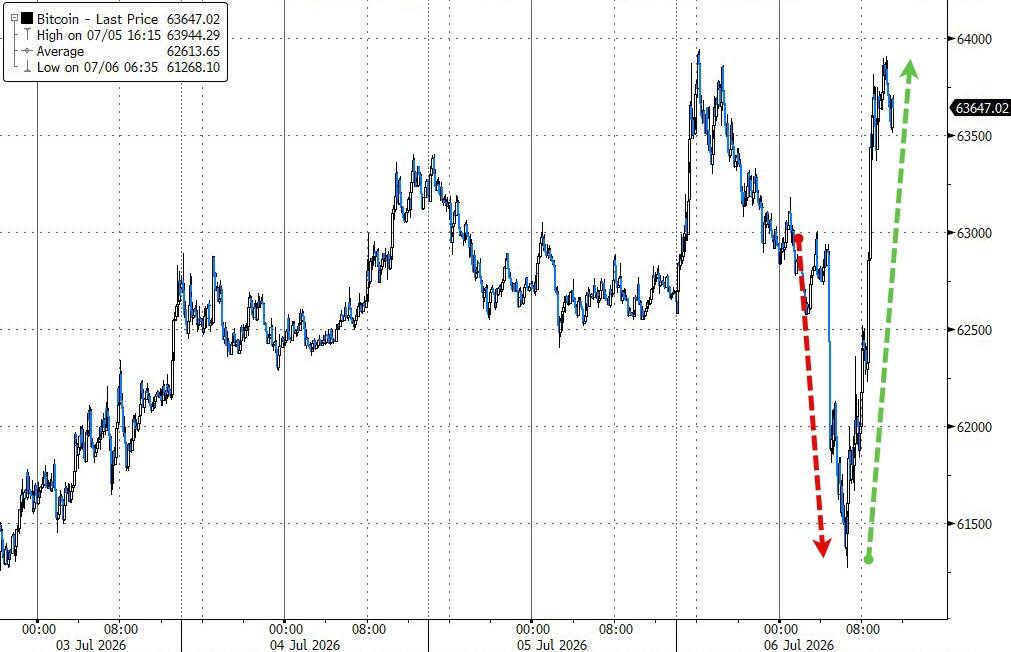
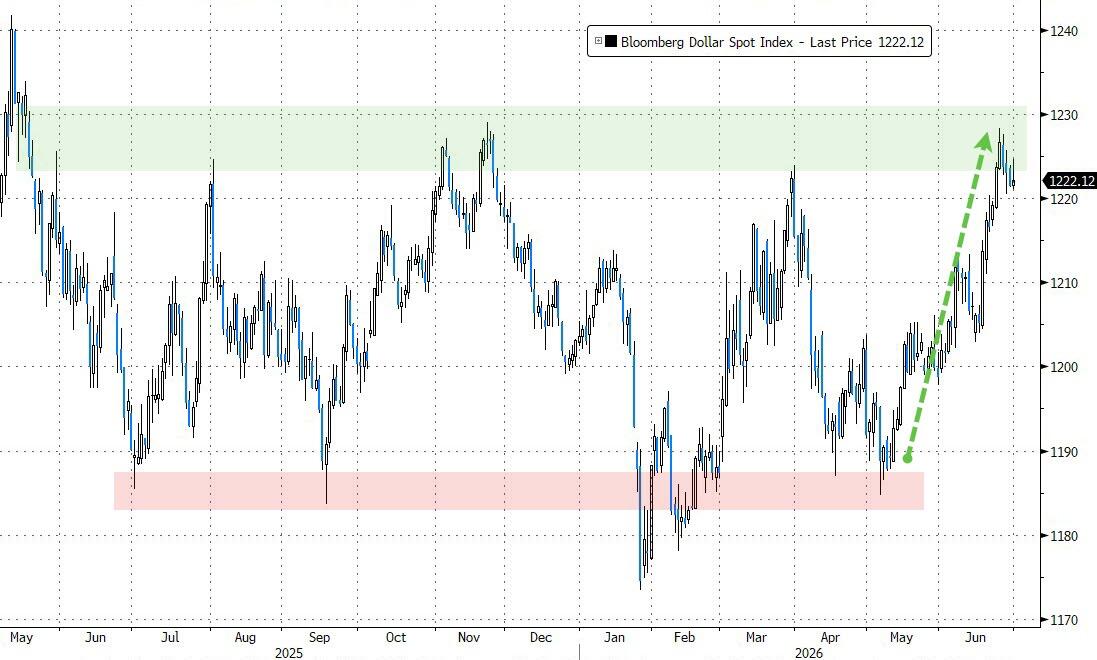
The dollar saw a round-trip session, while gold recovered from an early decline before closing slightly below the $4,100 level. Bitcoin, however, failed to participate in the tech rebound and ended the day lower.
For now, it appears that many traders have already moved past the Iran story, with several of the sectors and stocks most affected by the conflict fully reversing their initial reaction.
But if tensions continue to escalate, could the market be underestimating the risks ahead?
Read More