
- Moving the markets
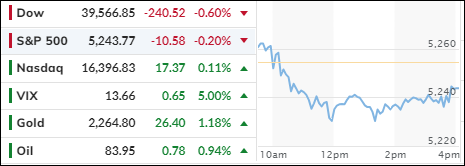
Today, the major stock indexes experienced a decline as Wall Street began the second quarter with a cautious eye on the latest U.S. inflation figures. These concerns stem from the possibility that the ongoing market rally might lose its momentum.
The Personal Consumption Expenditures (PCE) price index, excluding food and energy, indicated a 2.8% rise in inflation for February, aligning with analysts’ forecasts. This key inflation metric, which the Federal Reserve monitors closely, also showed a month-over-month increase of 0.3%.
Federal Reserve Chair Jerome Powell, in remarks made last Friday, suggested that there is no immediate need to lower interest rates, citing the current strength of economic growth and the labor market, despite inflation rates remaining above the target. Powell emphasized the importance of a cautious approach to any rate cuts, given the positive economic indicators and a downward trend in inflation.
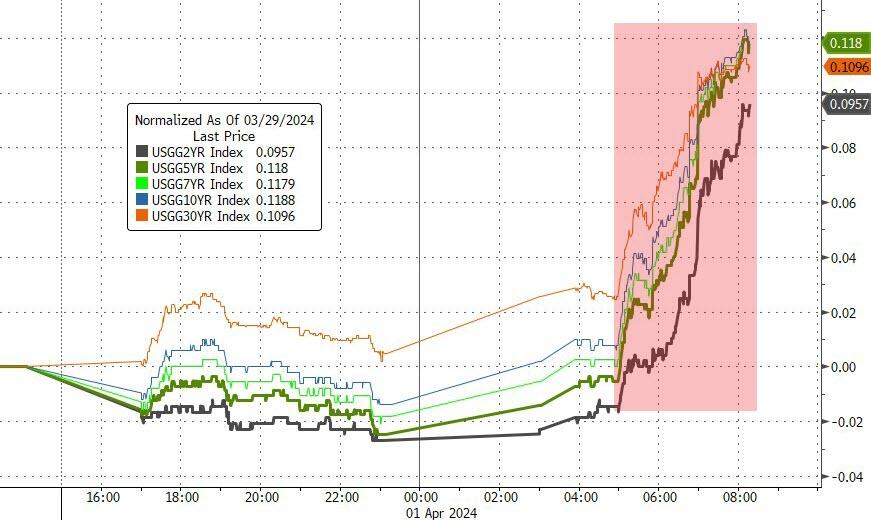
Following the release of this data and Powell’s comments, bond yields saw a significant uptick, with the benchmark 10-year Treasury yield climbing over 12 basis points to reach 4.33%. This rise in yields exerted pressure on the stock market throughout the day. In a somewhat unexpected turn, the dollar’s value increased, and concurrently, gold prices soared to new heights, signaling that concerns over inflation are still predominant.
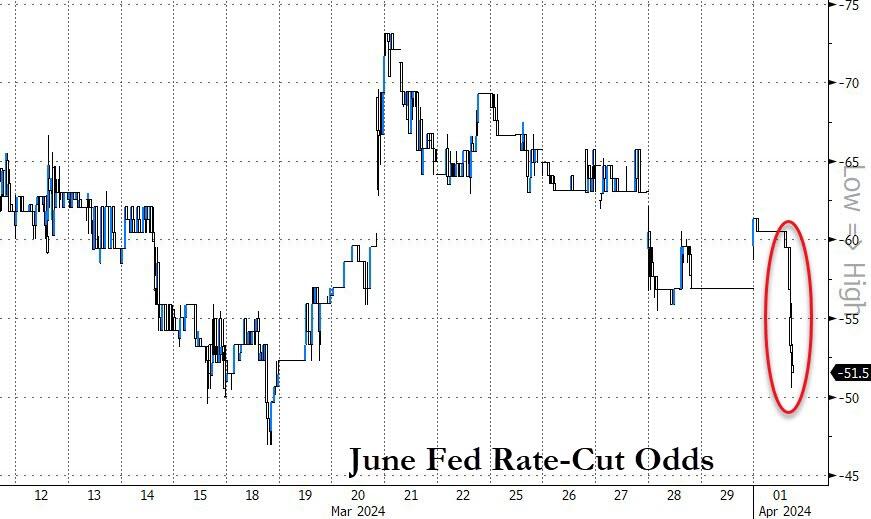
The likelihood of a rate cut in June has diminished, now standing at a 50% chance compared to last week’s more optimistic 75%. This shift is due in part to the persistent inflation signals emerging from various Purchasing Managers’ Indexes (PMIs).
With the markets appearing overextended by many standards, a correction seems inevitable. The critical question now is:
Could the combination of rising yields and gold prices be the catalyst for a market pullback?
2. Current “Buy” Cycles (effective 11/21/2023)
Our Trend Tracking Indexes (TTIs) have both crossed their trend lines with enough strength to trigger new “Buy” signals. That means, Tuesday, 11/21/2023, was the official date for these signals.
If you want to follow our strategy, you should first decide how much you want to invest based on your risk tolerance (percentage of allocation). Then, you should check my Thursday StatSheet and Saturday’s “ETFs on the Cutline” report for suitable ETFs to buy.
3. Trend Tracking Indexes (TTIs)
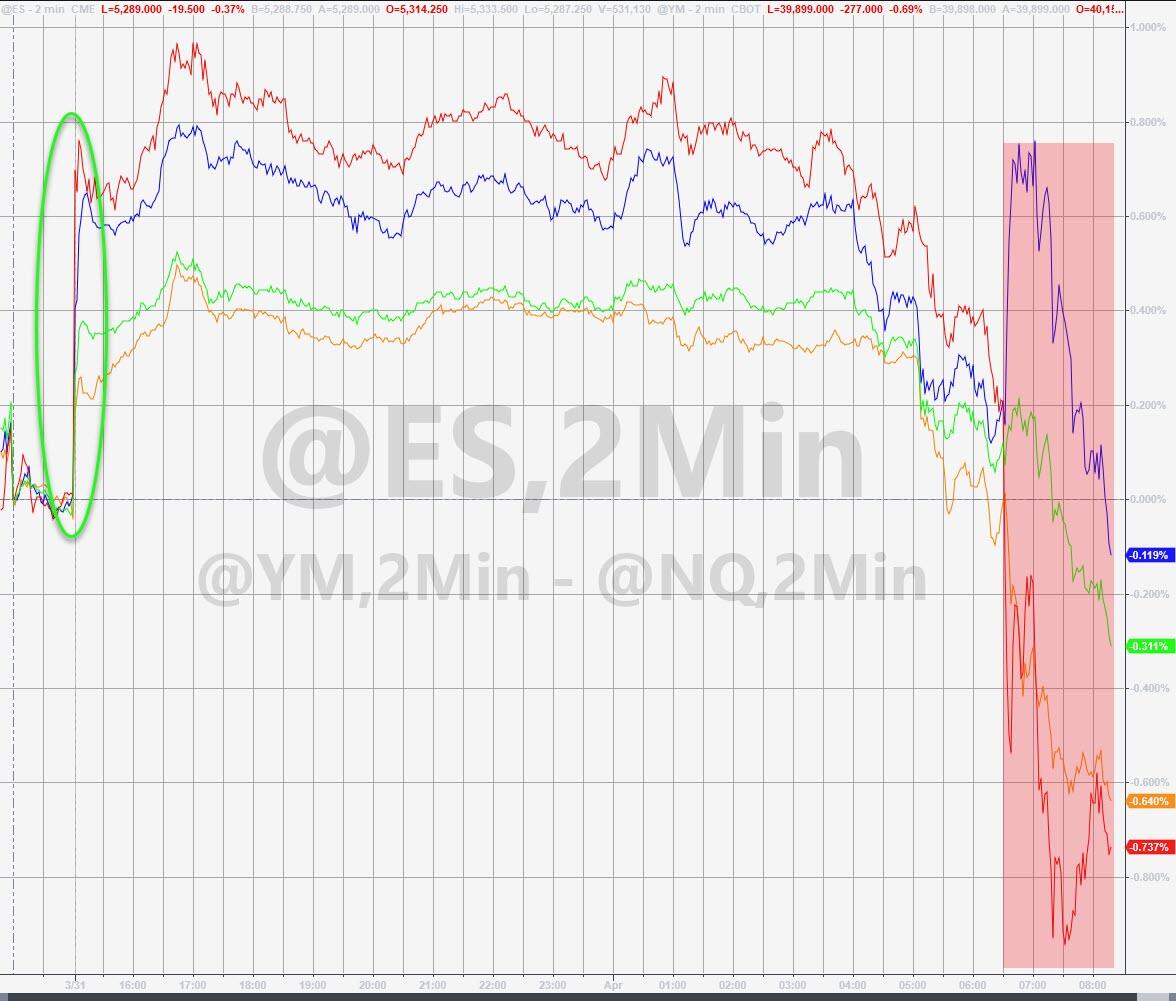
After an initial surge, the major indexes showed a lack of bullish momentum, primarily due to rising bond yields and increasing gold prices.
Consequently, the indexes closed with moderate losses, which was also reflected in our TTIs.
This is how we closed 4/01/2024:
Domestic TTI: +11.58% above its M/A (prior close +12.25%)—Buy signal effective 11/21/2023.
International TTI: +10.17% above its M/A (prior close +10.71%)—Buy signal effective 11/21/2023.
All linked charts above are courtesy of Bloomberg via ZeroHedge.
———————————————————-
WOULD YOU LIKE TO HAVE YOUR INVESTMENTS PROFESSIONALLY MANAGED?
Do you have the time to follow our investment plans yourself? If you are a busy professional who would like to have his portfolio managed using our methodology, please contact me directly to get more details.
—————————————————————-
Contact Ulli