
- Moving the markets
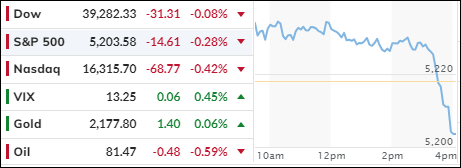
Today, U.S. stocks experienced a modest uptick as traders aimed to reignite the rally that previously propelled equities to record levels, despite a slight setback in the last session. Newly released economic figures revealed a 1.4% increase in orders for durable goods in February, surpassing economists’ predictions of 0.8%.
One analyst suggested that the combination of robust growth data and inflation rates exceeding forecasts may not be as dire as presumed, attempting to downplay the potential long-term impact of rising inflationary pressures.
Contrastingly, the consumer confidence index for March fell short of expectations, signaling a decline in economic optimism among U.S. consumers.
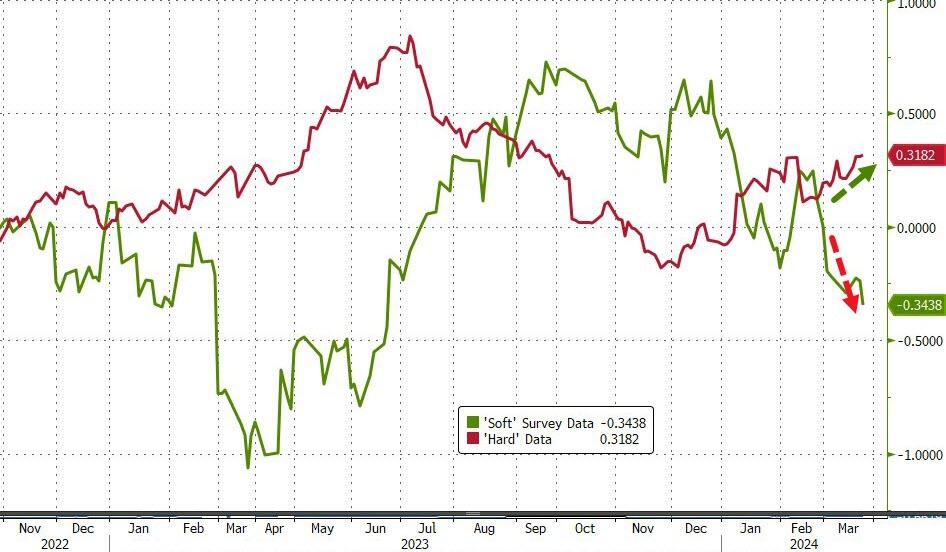
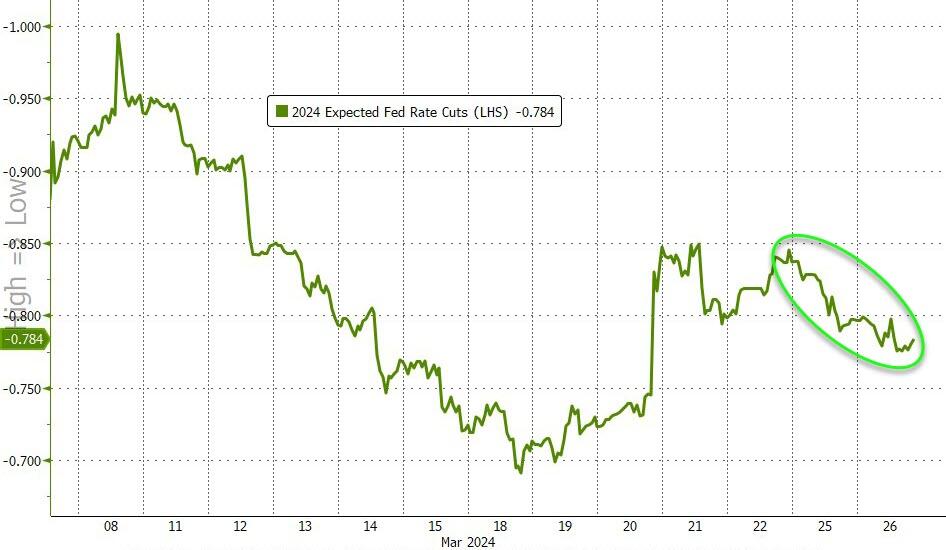
Despite this, the “hard data” showed signs of resilience, with a rebound in durable goods orders and a continued rise in home prices. This mix of discouraging and encouraging news nudged expectations for a rate cut slightly higher.
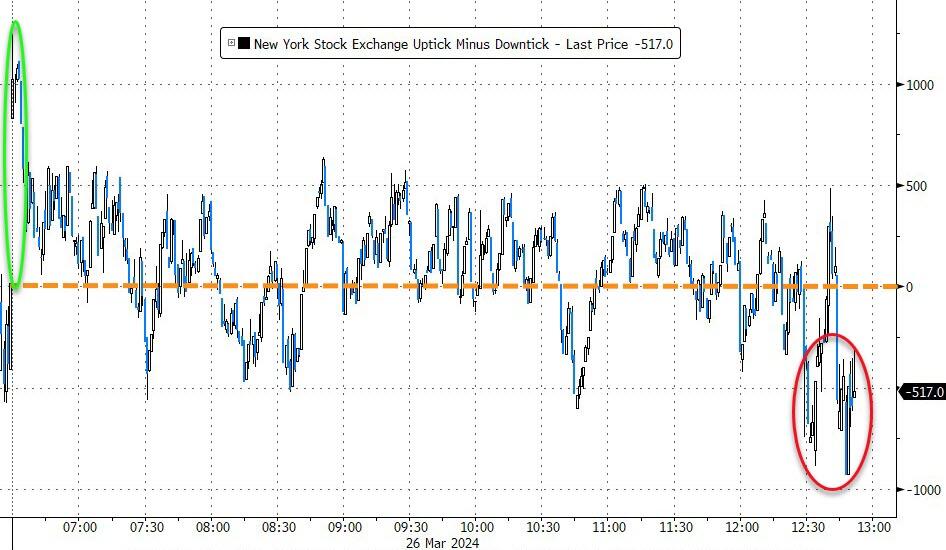
Initially, the market responded positively to this paradoxical situation, where good news was perceived negatively and vice versa. However, two late day sell programs ultimately led to a downturn in the major indexes, marking the S&P 500’s third consecutive day of losses.
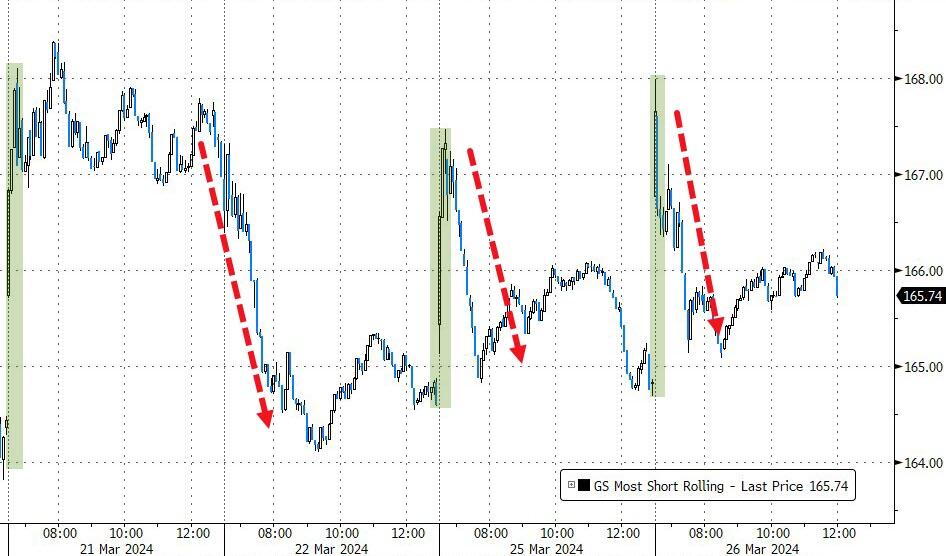
Concurrently, an early short squeeze quickly dissipated, echoing the pattern observed over the previous two days.
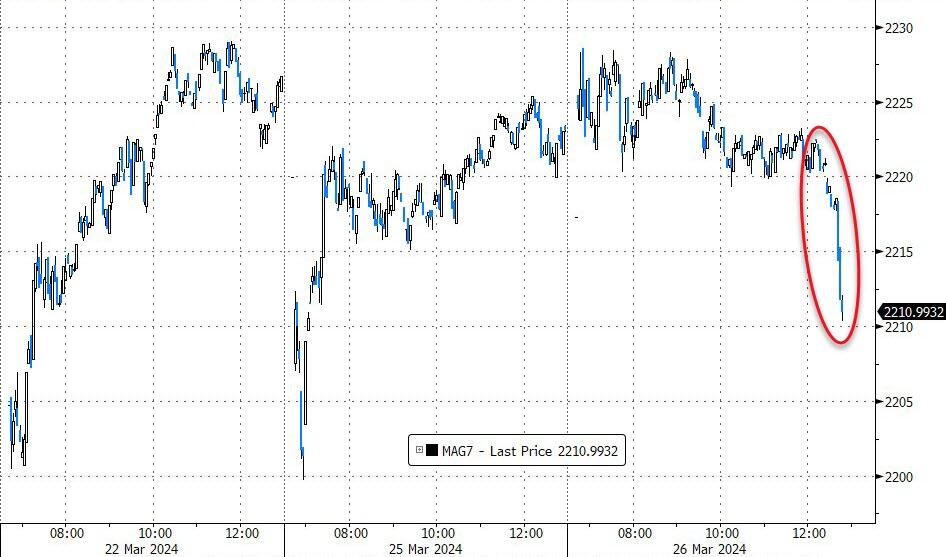
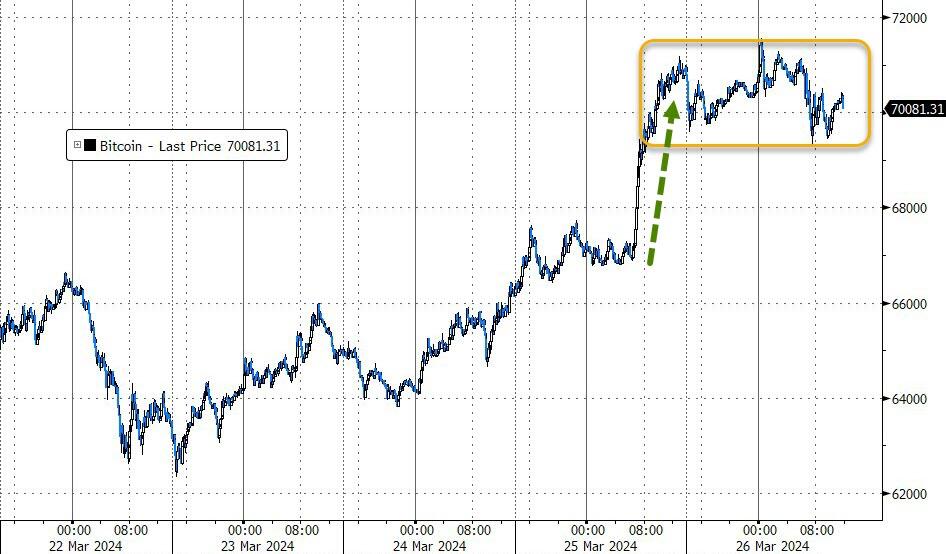
The MAG 7 stocks also experienced a sell-off. Bond yields fluctuated but remained relatively stable, while Bitcoin successfully maintained its $70k level after assimilating the prior day’s gains.
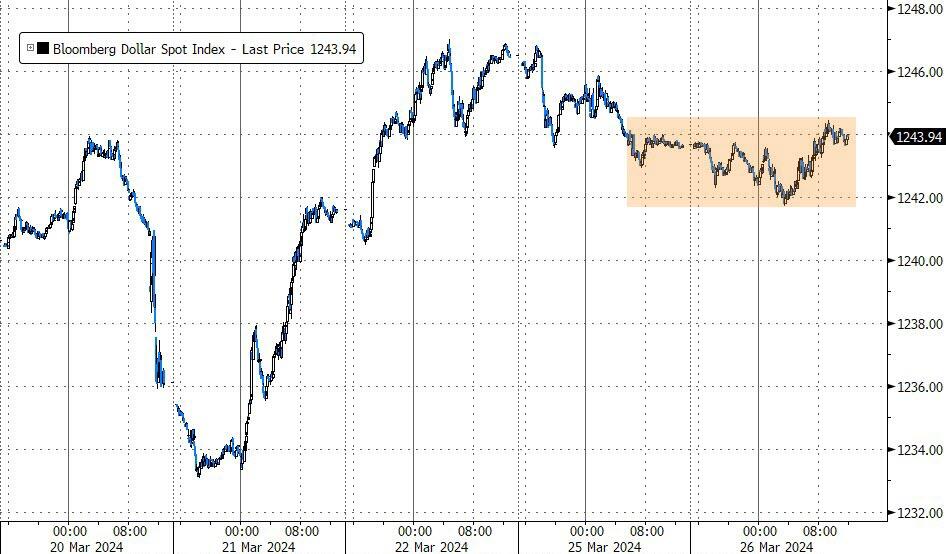
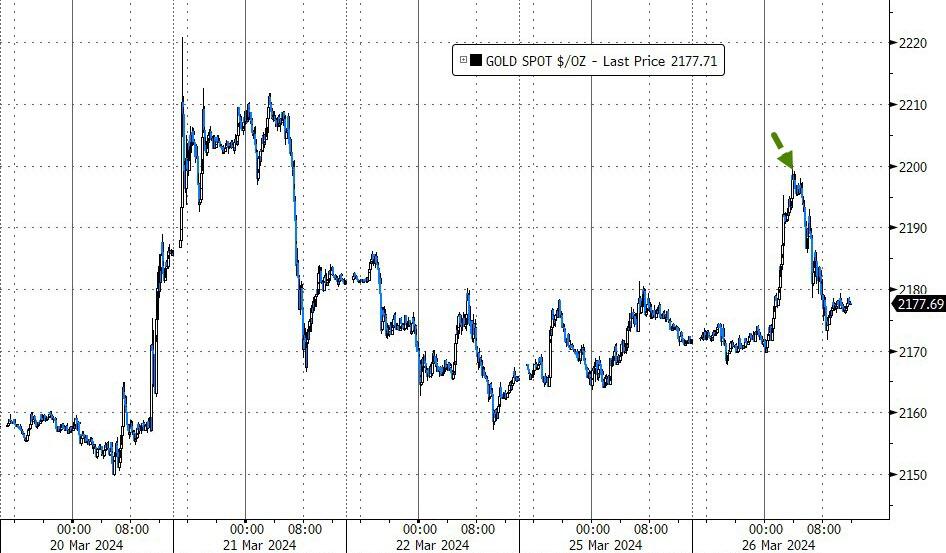
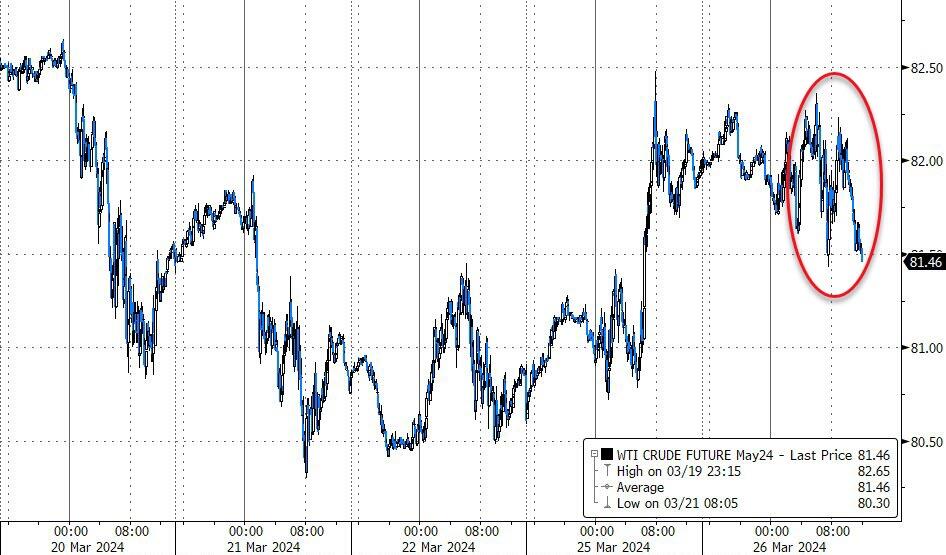
The dollar saw little movement, gold briefly approached the $2,200 mark before retreating to close with minimal gains, and oil prices experienced a slight decline in anticipation of the upcoming inventory data release.
As traders weigh these mixed signals, the question arises: Will the S&P 500 face its fourth consecutive day of decline, or will a resurgence of bullish sentiment steer the index back towards growth?
2. Current “Buy” Cycles (effective 11/21/2023)
Our Trend Tracking Indexes (TTIs) have both crossed their trend lines with enough strength to trigger new “Buy” signals. That means, Tuesday, 11/21/2023, was the official date for these signals.
If you want to follow our strategy, you should first decide how much you want to invest based on your risk tolerance (percentage of allocation). Then, you should check my Thursday StatSheet and Saturday’s “ETFs on the Cutline” report for suitable ETFs to buy.
3. Trend Tracking Indexes (TTIs)
In the final hour of trading, a wave of selling activity wiped out the gains from earlier in the day, resulting in a modest decline for the main stock indexes.
Similarly, our Trend Tracking Indexes (TTIs) mirrored this downturn and relinquished a small portion of their recent gains.
This is how we closed 3/26/2024:
Domestic TTI: +10.50% above its M/A (prior close +10.61%)—Buy signal effective 11/21/2023.
International TTI: +10.25% above its M/A (prior close +10.28%)—Buy signal effective 11/21/2023.
All linked charts above are courtesy of Bloomberg via ZeroHedge.
———————————————————-
WOULD YOU LIKE TO HAVE YOUR INVESTMENTS PROFESSIONALLY MANAGED?
Do you have the time to follow our investment plans yourself? If you are a busy professional who would like to have his portfolio managed using our methodology, please contact me directly to get more details.
—————————————————————-
Contact Ulli