
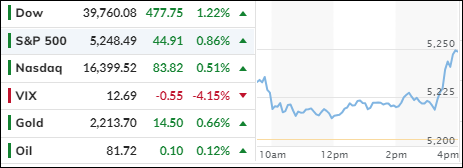
[Chart courtesy of MarketWatch.com]
- Moving the markets
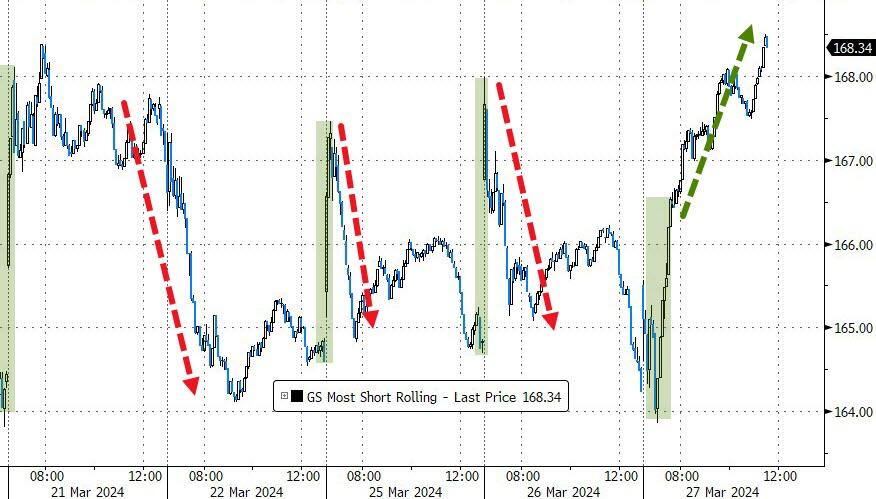
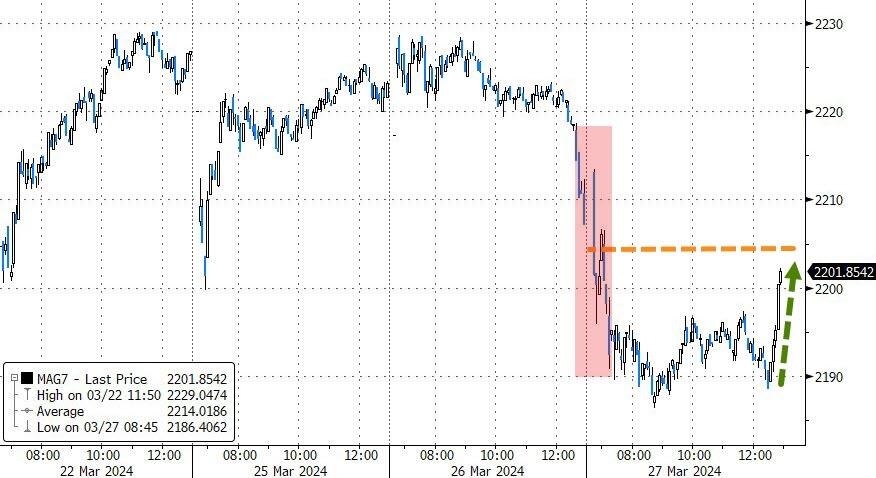
The S&P 500 bounced back, halting a three-day losing streak, buoyed by a substantial short squeeze that counteracted a $32 billion equity sell-off by pension funds. The tech-heavy MAG 7 staged a late-day rally, securing a positive close.
In the spotlight, Cintas shares soared 7% following impressive earnings, while Merck’s stock climbed nearly 5%, reaching a new peak. These gains come on the heels of a downturn earlier in the week, despite which, all major indexes are poised to conclude the month and quarter in positive territory when trading wraps up on Thursday.
Should this upward trend persist, it would signify the most robust first-quarter performance for the S&P 500 and Dow since 2019 and 2021, respectively, with anticipated increases of 13.1% and 7.4%. Moreover, all three indexes are on track for their fifth consecutive month of gains and a second successive quarter in the black.
While the market’s ascent continues, the looming threat of an unforeseen event could trigger a market correction. The question arises: Will an external shock disrupt the market’s current calm? Increased volatility in China’s market or interest rate adjustments in Mexico and Switzerland could be the catalysts for change, ushering in a period of uncertainty.
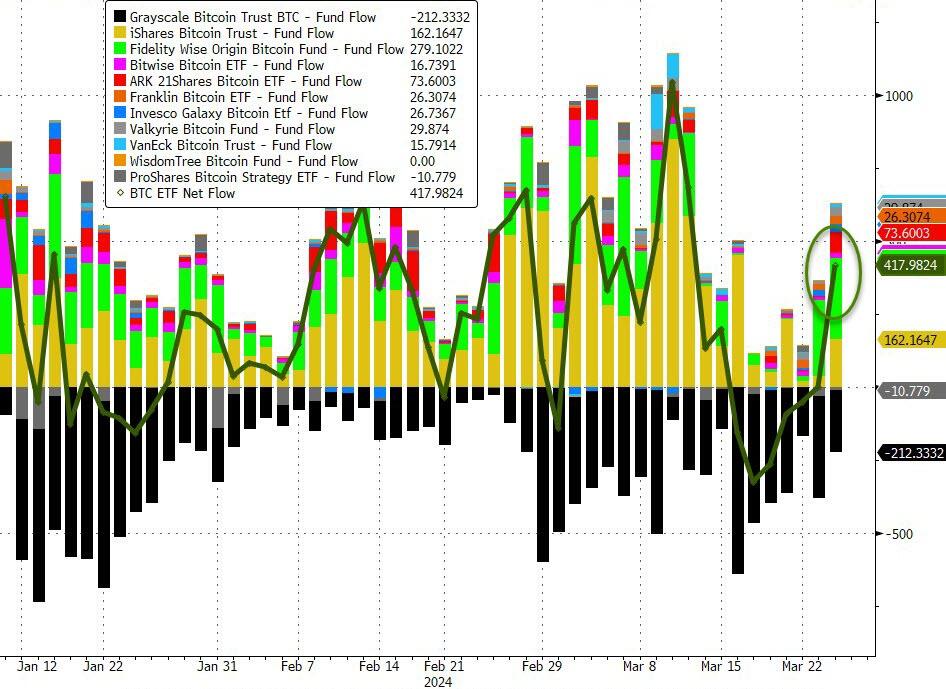
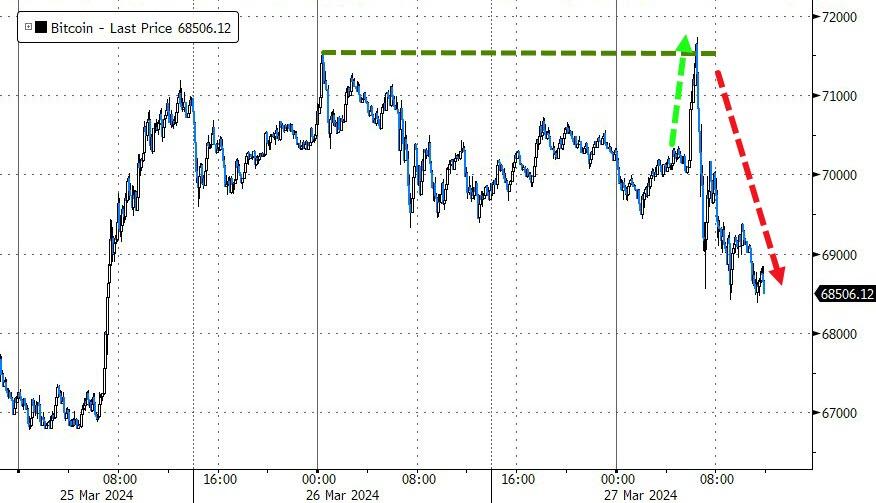
Bitcoin ETFs experienced a surge in inflow, leading to an initial spike, but the momentum faded as the SEC’s ongoing lawsuit against Coinbase dampened investor sentiment, resulting in increased selling and a retreat to the $69k level for Bitcoin.
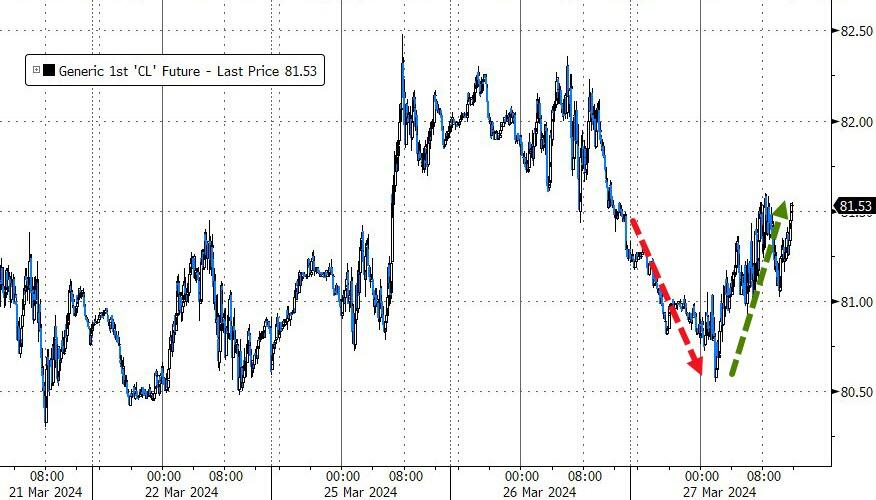
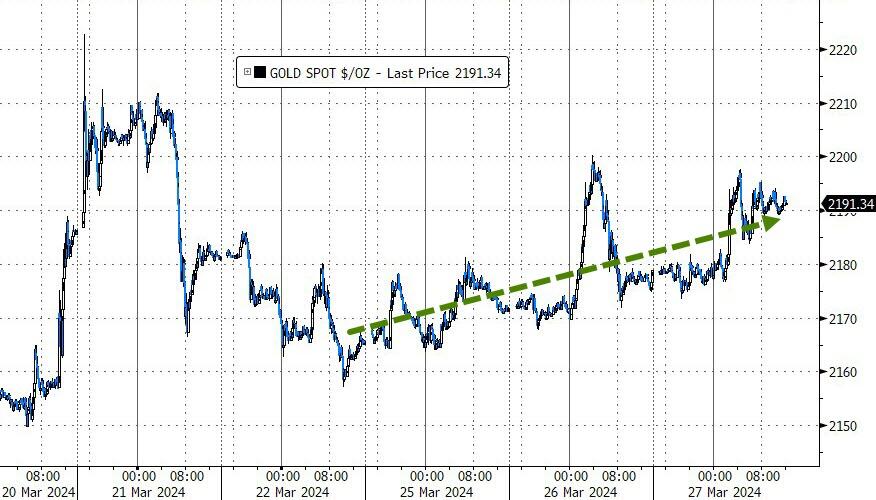
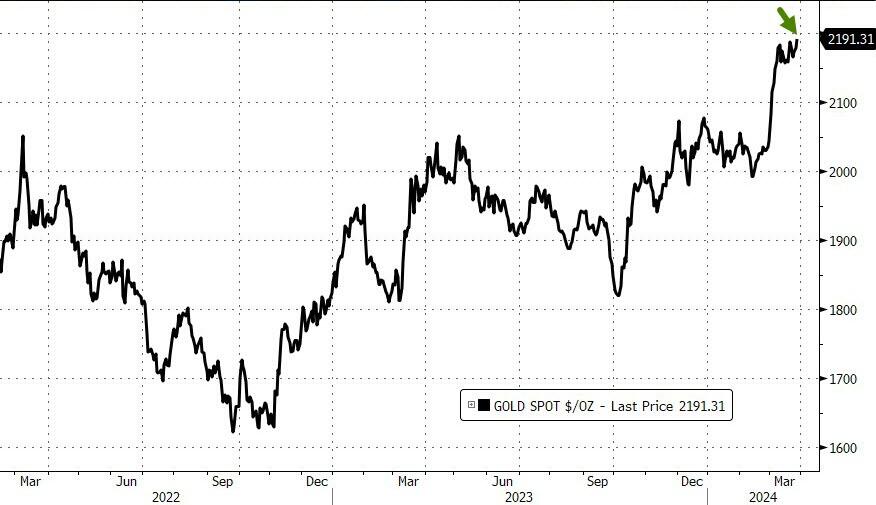
Oil prices made a comeback, offsetting the previous day’s declines. The dollar remained steady, while gold ascended, testing the $2,200 mark and closing at an all-time high in US dollars.
As we approach the final trading day of March, one wonders: What surprises might the markets hold in store for us tomorrow?
2. Current “Buy” Cycles (effective 11/21/2023)
Our Trend Tracking Indexes (TTIs) have both crossed their trend lines with enough strength to trigger new “Buy” signals. That means, Tuesday, 11/21/2023, was the official date for these signals.
If you want to follow our strategy, you should first decide how much you want to invest based on your risk tolerance (percentage of allocation). Then, you should check my Thursday StatSheet and Saturday’s “ETFs on the Cutline” report for suitable ETFs to buy.
3. Trend Tracking Indexes (TTIs)
The markets rebounded robustly, with the major indexes finishing in the green, reversing a three-day downward trend. A surge in the final hour of trading reinforced the day’s positive performance.
Additionally, our Trend Tracking Indexes (TTIs) also saw significant improvement, widening the gap from their trend lines considerably.
This is how we closed 3/27/2024:
Domestic TTI: +12.27% above its M/A (prior close +10.50%)—Buy signal effective 11/21/2023.
International TTI: +11.18% above its M/A (prior close +10.25%)—Buy signal effective 11/21/2023.
All linked charts above are courtesy of Bloomberg via ZeroHedge.
———————————————————-
WOULD YOU LIKE TO HAVE YOUR INVESTMENTS PROFESSIONALLY MANAGED?
Do you have the time to follow our investment plans yourself? If you are a busy professional who would like to have his portfolio managed using our methodology, please contact me directly to get more details.
—————————————————————-
Contact Ulli