Dow Skids; S&P 500 And Nasdaq Advance

Ulli Market Commentary Contact

[Chart courtesy of MarketWatch.com]
  1. Moving the markets

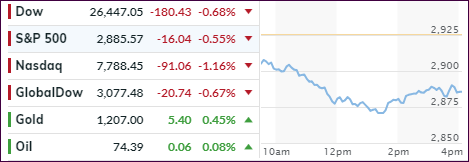
The tech and banking sector combined forces to put a floor under an early slide that helped the S&P 500 and Nasdaq to modest gains, but the Dow fell short of reaching the unchanged line by -0.06%, as 3M proved to be the baggage by sliding -1.5%.

While trade war rhetoric with China was noticeably absent, the warring factions simply changed, as Trump now traded barbs on Twitter Sunday evening with Iranian President Rouhani regarding alleged hostilities. That certainly did not give Wall Street traders the warm fuzzies and markets meandered for a while before settling down and cutting early losses.

At the same time, finance ministers and central bankers from the G20 had nothing to show for after a weekend meeting in Buenos Aires on trade tensions. That event reminded me of a tug-of-war with both parties digging in but neither one managing to get control of the rope.

As noted last week, earnings season will be kicking into high gear over the next few trading sessions. So far, earnings are up 21% this quarter, which is supposed to be a floor for further stock market advances. Of course, economic data points will have an influence as well and today’s existing home sales were anything but awe inspiring, as they suffered their worst losing streak since 2014. In June, they tumbled 0.6% MoM vs expectations of a 0.2% rise. Ouch!

Interest rates spiked with the 10-year yield jumping 7 basis points to 2.96%, its highest level in 5 weeks. That brings a total different meaning to my favorite chart in that the 30-year yield has now caught up to the level of the Nasdaq, when it would have been more likely for the Nasdaq to catch down to the level of the yield.

That simply goes to show that you can never be too certain, but we’ll have to wait and see if those two remain in sync or if this was just an aberration.

Read More

ETFs On The Cutline – Updated Through 07/20/2018

Ulli ETFs on the Cutline Contact

Below, please find the latest High Volume ETFs Cutline report, which shows how far above or below their respective long-term trend lines (39 week SMA) my currently tracked ETFs are positioned.

This report covers the HV ETF Master List from Thursday’s StatSheet and includes 366 High Volume ETFs ETFs, defined as those with an average daily volume of more than $5 million, of which currently 150 (last week 158) are hovering in bullish territory. The yellow line separates those ETFs that are positioned above their trend line (%M/A) from those that have dropped below it.

Take a look:

The HV ETF Master Cutline Report

In case you are not familiar with some of the terminology used in the reports, please read the Glossary of Terms.

If you missed the original post about the Cutline approach, you can read it here.

ETF Tracker Newsletter For July 20, 2018

Ulli ETF Tracker Contact

ETF Tracker StatSheet

https://theetfbully.com/2018/07/weekly-statsheet-for-the-etf-tracker-newsletter-updated-through-07-19-2018/

 STRUGGLING FOR DIRECTION

[Chart courtesy of MarketWatch.com]
  1. Moving the markets

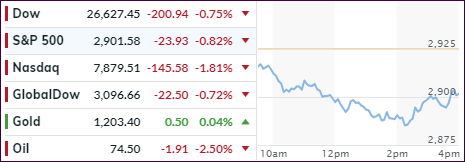
Equities ended the day and the week about unchanged while struggling for direction with the 3 major indexes clinging to the unchanged line. The S&P 500, for example, added only 1 point over the last 5 trading sessions but stayed on track for its 3rd straight weekly gain.

President Trump was at the center of two battles. First, there were the well-known and ongoing trade spats between the US and its varies counterparts, mainly China and the European Union, which left the markets at a high level of uncertainty.

This was followed by his displeasure of monetary policy accusing China and the EU of currency manipulation while adding that “Fed tightening now hurts all that we have done. The U.S. should be allowed to recapture what was lost due to illegal currency manipulation and BAD Trade Deals. Debt coming due & we are raising rates – Really?

The immediate reaction was a drop in the US Dollar, which gave gold a reason to rally after its recent spanking. Stocks, which had attempted a morning rally, reversed and headed south with losses (consumer discretionary and energy) being offset by advances (consumer staples and financials).

Interest rates spiked and roundtripped by erasing all of yesterday’s gains in the 10-year bond, the yield of which rose 5 basis points to 2.89% still below its March multi-year high of 3.11%.

Next week, earnings season kicks into high gear, and we should find out if there is enough firepower to overcome the 2 flies in the ointment for further market advances, AKA trade tariffs and currency manipulation.Read More

Weekly StatSheet For The ETF Tracker Newsletter – Updated Through 07/19/2018

Ulli ETF StatSheet Contact

ETF Data updated through Thursday, July 19, 2018

Methodology/Use of this StatSheet:

  1. From the universe of over 1,800 ETFs, I have selected only those with a trading volume of over $5 million per day (HV ETFs), so that liquidity and a small bid/ask spread are assured.
  2. Trend Tracking Indexes (TTIs)

Buy or Sell decisions for Domestic and International ETFs (section 1 and 2), are made based on the respective TTI and its position either above or below its long-term M/A (Moving Average). A crossing of the trend line from below accompanied by some staying power above constitutes a “Buy” signal. Conversely, a clear break below the line constitutes a “Sell” signal. Additionally, I use a 7.5% trailing stop loss on all positions in these categories to control downside risk.

  1. All other investment arenas do not have a TTI and should be traded based on the position of the individual ETF relative to its own respective trend line (%M/A). That’s why those signals are referred to as a “Selective Buy.” In other words, if an ETF crosses its own trendline to the upside, a “Buy” signal is generated. Since these areas tend to be more volatile, I recommend a wider trailing sell stop of 7.5% -10% depending on your risk tolerance.

If you are unfamiliar with some of the terminology, please see Glossary of Terms and new subscriber information in section 9.


  1. DOMESTIC EQUITY ETFs: BUY — since 4/4/2016

Click on chart to enlarge

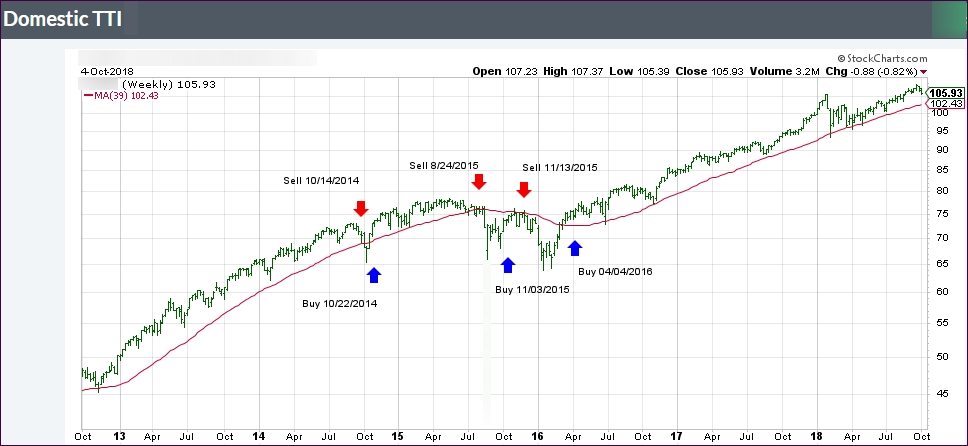
Our main directional indicator, the Domestic Trend Tracking Index (TTI-green line in the above chart) is positioned above its long-term trend line (red) by +2.83% after having generated a new Domestic Buy signal effective 4/4/2016 as posted.

Read More

Snapping The Winning Streak

Ulli Market Commentary Contact

[Chart courtesy of MarketWatch.com]
  1. Moving the markets

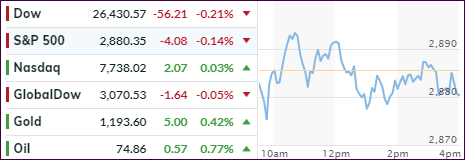
The Dow’s 5-day win streak came to an end today, as all 3 major indexes hit the skids and meandered below their respective unchanged lines throughout the session.

Trade war talk came to life suddenly and threatened bullish sentiment when Trump mentioned “tremendous retribution” not against China but this time against the European Union. Specifically, he addressed auto tariffs, should his meeting with EU officials next week not yield the desired “fair” results.

He also spooked the bond markets by remarking he wasn’t “thrilled” that the Fed was hiking rates, which put pressure on the financials with XLF getting spanked at the rate of -1.50%. While the 10-year bond dropped 4 basis points to 2.84%, equites in general were not impacted.

Earnings so far have been called “fantastic” by the Wall Street crowd, although some disappointments appeared this morning keeping buyers on the sidelines. However, to me it seems that the biggest scare was the sudden jawboning over trade wars. As I mentioned before, this is one powder keg that, once it explodes, could derail the earning season in a hurry.

Let’s see how things turns out when Trump travels to Europe next week.

Read More

Keeping Upward Momentum Alive

Ulli Market Commentary Contact

[Chart courtesy of MarketWatch.com]
  1. Moving the markets

The major indexes followed through from yesterday’s advance to close higher with the Dow logging its fifth positive session, while the Nasdaq lagged slightly and fell just short of crossing its unchanged line to the upside.

The markets were still influenced by the Fed’s upbeat description of a domestic economy, which has expanded but is limited in further growth due to an alleged lack of skilled workers while, at the same time, rising material costs are the fly in the ointment to further expansion. Out of the 12 Fed districts, 11 of them were growing at a “modest” pace while one of them experienced “slight” growth. I am not sure if this is a worthwhile distinction.

In the end, Fed’s Powell repeated many of his assertions made yesterday and confirmed that interest rates will “continue to go up every three months for now.” Surprisingly, this firm statement had no effect on market behavior, but it made future rate hikes a little more predictable, while putting the pressure on upcoming earnings to keep the bullish meme going.

Taking top billing for the day were Transportations (IYT), which stormed ahead and gained a solid +2.27% (best day in 3 months) with Semiconductors taking a distant second with a respectable +1.02% performance.

Helping matters was the VIX, which was pushed down to the 11 level for the first time in a month. We’re now waiting to see if the much-hyped earnings season can live up to expectations to help the bullish cause.

Read More