A Slow Start Followed By A Solid Finish

Ulli Market Commentary Contact

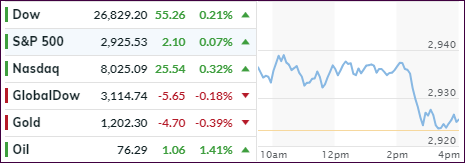
[Chart courtesy of MarketWatch.com]
  1. Moving the markets

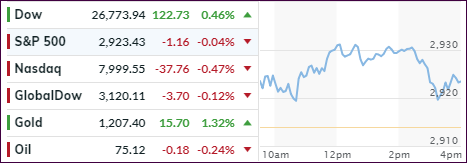
Fed chair Powell threw an assist to the markets by announcing that “the U.S. central bank wouldn’t move too quickly in changing monetary policy, and that it would be flexible in the face of changing conditions.

He also informed the Senate Banking Committee that the “best way forward is to keep ‘gradually’ raising the federal-funds rate for now.” That was music to the ears of traders, who prefer a dovish approach to interest rate hikes as it supports equity markets, as opposed to a more aggressive (hawkish) approach, which creates bearish conditions.

Despite him throwing in the disclaimer that trade wars and fiscal policy were big unknowns, his remarks were sufficiently upbeat to pull the indexes out of an early slump and the Dow notched its 4th day of gains.

Despite Netflix disappointing, it fell -5.2%, which was well off its lows, it allowed the Nasdaq to take leadership for the day with a +0.63% gain vs. the Dow’s +0.22% and the S&P’s +0.40%.

Absent any sudden surprises, it’s now up to the earnings season to provide the ammunition needed to propel equities higher.

Read More

Waiting For The Earning Season

Ulli Market Commentary Contact

[Chart courtesy of MarketWatch.com]
  1. Moving the markets

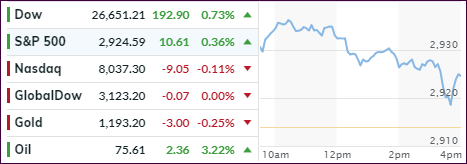
The markets meandered aimlessly with the major indexes showing a mixed picture as the S&P 500 and Nasdaq pulled back while the Dow managed to stay above the unchanged line.

Presidents Trump and Putin met as planned in Helsinki, but even a joint conference did not motivate buyers to pile into equities. In other words, the meeting of the world leaders was a non-event as far as markets was concerned.

Of course, the focus on Wall Street is the upcoming earnings season which, for the time being, seems to overshadow all other events. So far, we’ve only had a couple of banks reporting, and traders are homing in on fundamentals, which to some signals strong domestic activity.

Of course, there is always the elephant in the room named “trade news,” which at any time could interrupt supporting equity moves to the upside. As I am writing this, Monday afternoon, the first fly in the ointment appeared as Netflix’s stock plunged some 13% with subscriber growth slowing and cash burn soaring.

We all like to know what will happen next in the markets. Will there be a summer rally or will disappointment reign? Cycles can at times predict, with various degrees of certainty, as to what happens next. Of course, nothing is ever 100%, but this chart looks interesting.

This summer appears to be anything but boring.

Read More

ETFs On The Cutline – Updated Through 07/13/2018

Ulli ETFs on the Cutline Contact

Below, please find the latest High Volume ETFs Cutline report, which shows how far above or below their respective long-term trend lines (39 week SMA) my currently tracked ETFs are positioned.

This report covers the HV ETF Master List from Thursday’s StatSheet and includes 366 High Volume ETFs ETFs, defined as those with an average daily volume of more than $5 million, of which currently 158 (last week 146) are hovering in bullish territory. The yellow line separates those ETFs that are positioned above their trend line (%M/A) from those that have dropped below it.

Take a look:

The HV ETF Master Cutline Report

In case you are not familiar with some of the terminology used in the reports, please read the Glossary of Terms.

If you missed the original post about the Cutline approach, you can read it here.

ETF Tracker Newsletter For July 13, 2018

Ulli ETF Tracker Contact

ETF Tracker StatSheet

https://theetfbully.com/2018/07/weekly-statsheet-for-the-etf-tracker-newsletter-updated-through-07-12-2018/

 BUILDING ON LAST WEEK’S ADVANCE

[Chart courtesy of MarketWatch.com]
  1. Moving the markets

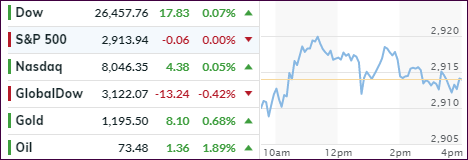
At least for the time being, Wall Street traders managed to shake off the headwind known as ‘trade disagreements’ and push equities higher, not just this week, but also sporting gains the last six out of seven trading days. The exception was last Wednesday, when markets dumped, but they were pumped higher instantly on Thursday thereby eliminating any doubt as to whether bullish momentum was impaired or not. However, when looking at this chart, I agree with ZH’s question: What happens next?

Two milestones were reclaimed today, namely the Dow’s 25k level and the S&P’s 2.8k marker, while the Nasdaq powered to a new record all in anticipation that the earnings season will not be disappointing, although early reads have been mixed at best.

For the week, the Dow led the major indexes with +2.3%, followed by the Nasdaq with +1.8% and the S&P 500 (+1.5%) concluding two consecutive weekly advances for all of them.

Let’s be clear, the variety of trade issues are far from having been resolved and will likely remain a concern, which may pop up suddenly during the next few weeks and curtail “the running of the bulls.” How much of an effect this will be on equities obviously depends on whether trade disputes are turning into trade wars or are simple negotiation ploys.

On the other hand, ever since Trump started initiating tariffs, bonds and stocks have rallied bringing up the question: Will more tariffs drive the markets higher? This chart implies tongue in cheek that they might.

Go figure…

Read More

Weekly StatSheet For The ETF Tracker Newsletter – Updated Through 07/12/2018

Ulli ETF StatSheet Contact

ETF Data updated through Thursday, July 12, 2018

Methodology/Use of this StatSheet:

  1. From the universe of over 1,800 ETFs, I have selected only those with a trading volume of over $5 million per day (HV ETFs), so that liquidity and a small bid/ask spread are assured.
  2. Trend Tracking Indexes (TTIs)

Buy or Sell decisions for Domestic and International ETFs (section 1 and 2), are made based on the respective TTI and its position either above or below its long-term M/A (Moving Average). A crossing of the trend line from below accompanied by some staying power above constitutes a “Buy” signal. Conversely, a clear break below the line constitutes a “Sell” signal. Additionally, I use a 7.5% trailing stop loss on all positions in these categories to control downside risk.

  1. All other investment arenas do not have a TTI and should be traded based on the position of the individual ETF relative to its own respective trend line (%M/A). That’s why those signals are referred to as a “Selective Buy.” In other words, if an ETF crosses its own trendline to the upside, a “Buy” signal is generated. Since these areas tend to be more volatile, I recommend a wider trailing sell stop of 7.5% -10% depending on your risk tolerance.

If you are unfamiliar with some of the terminology, please see Glossary of Terms and new subscriber information in section 9.


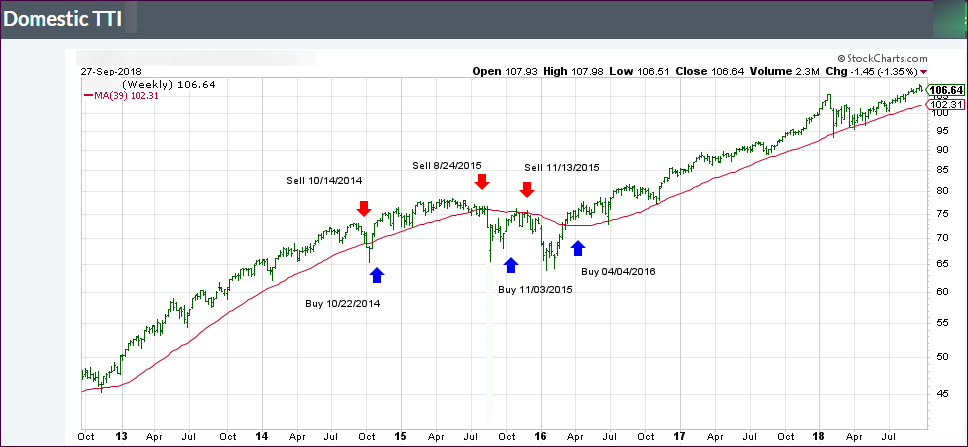
  1. DOMESTIC EQUITY ETFs: BUY — since 4/4/2016

Click on chart to enlarge

Our main directional indicator, the Domestic Trend Tracking Index (TTI-green line in the above chart) is positioned above its long-term trend line (red) by +2.75% after having generated a new Domestic Buy signal effective 4/4/2016 as posted.

Read More

Tech Leads The Indexes And Pushes Nasdaq To Record Close

Ulli Market Commentary Contact

[Chart courtesy of MarketWatch.com]
  1. Moving the markets

Yesterday’s market dump turned into today’s market pump with the major indexes recovering as a tech led rally pushed the Nasdaq to a record close.

What changed from yesterday?

Not much, other than that sentiment took a turn for the better following news reports that the US and China are working to ease tensions via the resumption of trade talks. That helped to propel the markets higher in line with the recent “trade wars on, trade wars off” theme, which either helped or hurt the indexes depending on which was more prevalent on any given day.

At the same time, we may be seeing a new tug-of-war in the making, namely “trade war vs. earnings” with some Wall Street traders opining that the trade disputes will move to the back burner once the highly anticipated earnings season gets into full gear over the next 2 weeks, that it will overshadow all other concerns.

Maybe so, but earnings expectations are high with strong growth for profits and revenue to be a given. The uncertain part, however, is this one: Will companies continue with their history of topping analysts’ expectations by such large numbers as in the recent past? If they don’t, it certainly could cause disappointment and, given current high market evaluations, anything less than perfection may give way to bearish sentiment.

In the meantime, the roller coaster ride is bound to continue…

Read More