
ETF Tracker StatSheet
SPIKING YIELDS = HEADWIND FOR EQUITIES
- Moving the markets
Summing up the week best, was ZH with this final tally:
- Unemployment Rate at 49-year lows
- US Stocks – worst 2-day drop since May
- Small Caps, Nasdaq – biggest weekly drop in 7 months
- Small Caps – biggest 5-week drop since Nov 2016
- China (closed) ETF – biggest weekly drop in 7 months
- Semis – biggest weekly drop in 6 months
- FANGs – biggest weekly drop in 7 months
- Homebuilders – worst.losing.streak.ever…
- USD Index – best week in 2 months
- HY Bonds – biggest weekly price drop in 8 months
- IG Bonds – biggest weekly drop since Nov 2016
- Treasury Yields – biggest weekly yield spike in 8 months
- Yield Curve – biggest weekly steepening in 8 months
- Gold – best weekly gain in 6 weeks
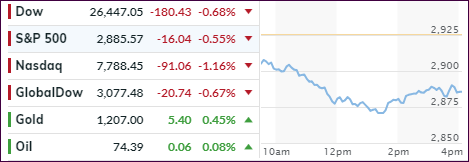
The market slump continued with Homebuilders, SmallCaps, Nasdaq, the FANGs and Semiconductors all getting hammered to varying degrees with SmallCaps being the worst performer closely followed by the Nasdaq. To no surprise, the VIX spiked to over 17, a level which we have not seen since June.
The jobs report missed, as only 134k jobs were added vs. expectations of 185k. That was not too much of a surprise, as the hurricane had a major impact with 229k people not being at work due to bad weather. Offsetting this September weakness was the August upward revision from 201k to 270k.
The unemployment rate ticked lower to 3.7%, its lowest level in 48 years. More importantly, wages were rising 0.3% on the month or 2.8% on the year which, when combined with the low unemployment rate, created worries about inflationary impacts.
That in turn sent bond yields on another rally with the 10-year spiking to 3.24% intra-day before closing at 3.23%, a gain of almost 5 basis points. If this trend continues, equities are in for a major surprise during this already ‘red’ October, as rising yields will eventually spell the end of the bullish environment.
This may be just the beginning but, despite prevailing international weakness, the major trend in the domestic arena remains bullish for the time being.
- ETFs in the Spotlight
In case you missed the announcement and description of this section, you can read it here again.
It features 10 broadly diversified and sector ETFs from my HighVolume list as posted every Saturday. Furthermore, they are screened for the lowest MaxDD% number meaning they have been showing better resistance to temporary sell offs than all others over the past year.
The below table simply demonstrates the magnitude with which some of the ETFs are fluctuating regarding their positions above or below their respective individual trend lines (%M/A). A break below, represented by a negative number, shows weakness, while a break above, represented by a positive percentage, shows strength.
For hundreds of ETF choices, be sure to reference Thursday’s StatSheet.
Year to date, here’s how our candidates have fared so far:
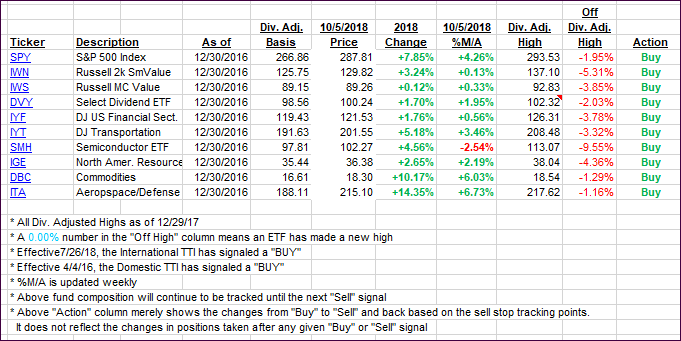
Again, the %M/A column above shows the position of the various ETFs in relation to their respective long-term trend lines, while the trailing sell stops are being tracked in the “Off High” column. The “Action” column will signal a “Sell” once the -8% point has been taken out in the “Off High” column. For more volatile sector ETFs, the trigger point is -10%.
- Trend Tracking Indexes (TTIs)
Our Trend Tracking Indexes (TTIs) continued their southerly trend with the International one dipping into bear market territory. Since it barely crossed below its trend line, I will wait for more confirmation before declaring this “Buy” cycle to be over. We’ve seen these dips on various occasions since the bullish signal was generated on 7/26/18.
Here’s how we closed 10/05/2018:
Domestic TTI: +2.92% above its M/A (last close +3.54%)—Buy signal effective 4/4/2016
International TTI: -0.18% below its M/A (last close +0.37%)—Buy signal effective 7/26/2018
Disclosure: I am obliged to inform you that I, as well as my advisory clients, own some of the ETFs listed in the above table. Furthermore, they do not represent a specific investment recommendation for you, they merely show which ETFs from the universe I track are falling within the guidelines specified.
————————————————————-
READER Q & As
All Reader Q & A’s are listed at our web site!
Check it out at:
https://theetfbully.com/questions-answers/
———————————————————-
WOULD YOU LIKE TO HAVE YOUR INVESTMENTS PROFESSIONALLY MANAGED?
Do you have the time to follow our investment plans yourself? If you are a busy professional who would like to have his portfolio managed using our methodology, please contact me directly or get more details at:
https://theetfbully.com/personal-investment-management/
———————————————————
Back issues of the ETF/No Load Fund Tracker are available on the web at:
https://theetfbully.com/newsletter-archives/
Contact Ulli