ETFs On The Cutline – Updated Through 07/27/2018

Ulli ETFs on the Cutline Contact

Below, please find the latest High Volume ETFs Cutline report, which shows how far above or below their respective long-term trend lines (39 week SMA) my currently tracked ETFs are positioned.

This report covers the HV ETF Master List from Thursday’s StatSheet and includes 366 High Volume ETFs ETFs, defined as those with an average daily volume of more than $5 million, of which currently 175 (last week 150) are hovering in bullish territory. The yellow line separates those ETFs that are positioned above their trend line (%M/A) from those that have dropped below it.

Take a look:

The HV ETF Master Cutline Report

In case you are not familiar with some of the terminology used in the reports, please read the Glossary of Terms.

If you missed the original post about the Cutline approach, you can read it here.

ETF Tracker Newsletter For July 27, 2018

Ulli ETF Tracker Contact

ETF Tracker StatSheet

https://theetfbully.com/2018/07/weekly-statsheet-for-the-etf-tracker-newsletter-updated-through-07-26-2018/

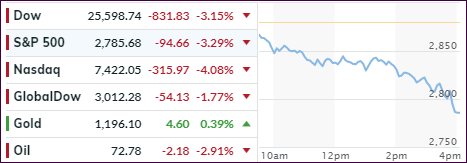
 AN UGLY ENDING

[Chart courtesy of MarketWatch.com]
  1. Moving the markets

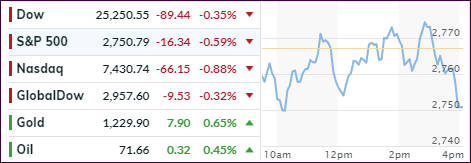
Despite Amazon showing some glow in its earnings report, it was not enough to bail out the weaklings, namely Netflix, Twitter and Facebook, which combined to pull the tech sector off its lofty level. Other bellwethers that disappointed were Exxon and Intel causing the major indexes to have a mixed week. The Dow and S&P 500 added 1.6% and 0.6% respectively, but the Nasdaq bucked the trend and lost 1.1%. SmallCaps (SCHA) joined the losers by surrendering 1.64%.

The GDP report came out showing an economy that grew at a 4.1% rate in the second quarter, which was the fastest pace in some 4 years. However, it did not please the Wall Street crowd whose expectations were 4.2%.

Personally, I have learned not to put too much credence in that first reading, since more times than not, this first estimate will be downwardly adjusted. In the meantime, however, this number will be taken as a sign that the Fed’s planned interest rate hikes will remain on schedule. On the day, the 10-year bond did not show much of a reaction with its yield slipping 2 basis points to close at 2.96%.

Amazon was the bright spot for the weak with its biggest quarterly profit in history, along with earnings that were twice of what was expected. Still, it was not enough to keep the tech sector from getting mauled throughout the week.

It remains to be seen if this week’s tech wreck can be repaired in the coming weeks, or if there is more fallout to come. Technically speaking, no damage was done to the QQQ ETF, but should it sink below its support line around 175, more downside risk may come into play. However, for right now, it maintains its position as a YTD performance leader.

Read More

Weekly StatSheet For The ETF Tracker Newsletter – Updated Through 07/26/2018

Ulli ETF StatSheet Contact

ETF Data updated through Thursday, July 26, 2018

Methodology/Use of this StatSheet:

  1. From the universe of over 1,800 ETFs, I have selected only those with a trading volume of over $5 million per day (HV ETFs), so that liquidity and a small bid/ask spread are assured.
  2. Trend Tracking Indexes (TTIs)

Buy or Sell decisions for Domestic and International ETFs (section 1 and 2), are made based on the respective TTI and its position either above or below its long-term M/A (Moving Average). A crossing of the trend line from below accompanied by some staying power above constitutes a “Buy” signal. Conversely, a clear break below the line constitutes a “Sell” signal. Additionally, I use a 7.5% trailing stop loss on all positions in these categories to control downside risk.

  1. All other investment arenas do not have a TTI and should be traded based on the position of the individual ETF relative to its own respective trend line (%M/A). That’s why those signals are referred to as a “Selective Buy.” In other words, if an ETF crosses its own trendline to the upside, a “Buy” signal is generated. Since these areas tend to be more volatile, I recommend a wider trailing sell stop of 7.5% -10% depending on your risk tolerance.

If you are unfamiliar with some of the terminology, please see Glossary of Terms and new subscriber information in section 9.


  1. DOMESTIC EQUITY ETFs: BUY — since 4/4/2016

Click on chart to enlarge

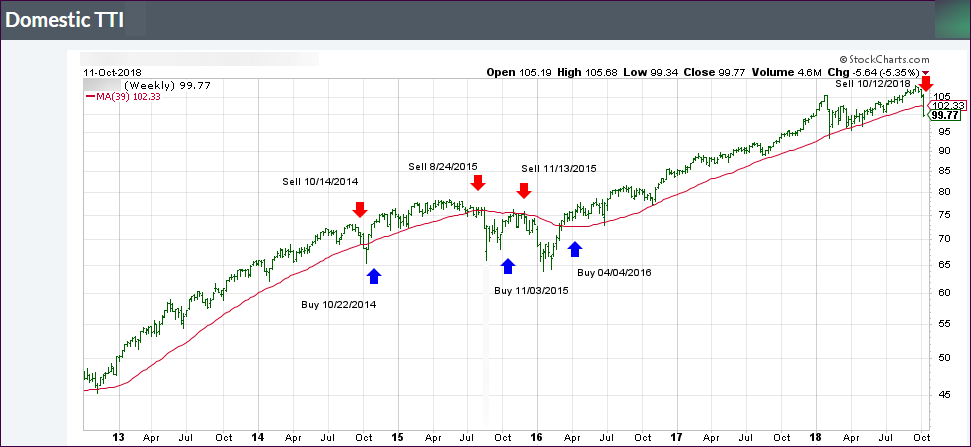
Our main directional indicator, the Domestic Trend Tracking Index (TTI-green line in the above chart) is positioned above its long-term trend line (red) by +2.82% after having generated a new Domestic Buy signal effective 4/4/2016 as posted.

Read More

Diverging Markets

Ulli Market Commentary Contact

[Chart courtesy of MarketWatch.com]
  1. Moving the markets

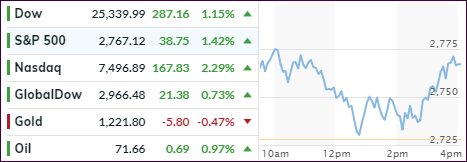
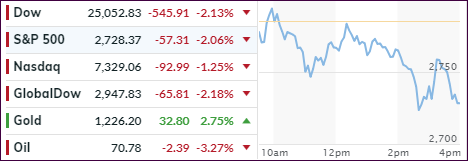
As I pointed out yesterday, Facebook’s (FB) horrific earnings report and news of further revenue deceleration for the second half of this year did spread to the Nasdaq, which stumbled and surrendered most of yesterday’s gains. Not only did FB end up losing $123 billion of its market cap, insider trading rumors are sure to be pursued.

The fallout from FB’s jaw dropping one-day loss goes even deeper, as the stock has been the darling of the hedge fund industry, which lost an estimated $6 billion in a matter of hours. Surely, FB will very likely not appear in their top 10 list for a while.

Quipped ZH: FB’s Zuckerberg lost $15 billion overnight. How will he get by on just $70 billion?

The S&P 500 followed to the downside with a modest -0.30% loss, while the Dow diverged and closed in the green as the earnings season continued in full force. Some major companies reported better-than-expected results, which may offset some of the negativity spread by FB.

While unexpected surprises, such as FB, can rock the markets, they may very well be isolated events and not reflective of overall market direction. Of course, more bad tech news (Amazon earnings are on deck), along with trade war talks, can make their presence known at any time and suddenly increase uncertainty and risk—something that we simply must live with.

If the risk gets too high in any one asset class, our trailing sell stops will point the way to the exit door to reduce exposure and therefore limit portfolio damage.

Read More

Easing EU Trade Tensions Propel Equities; International “Buy” generated

Ulli Market Commentary Contact

[Chart courtesy of MarketWatch.com]
  1. Moving the markets

Trade tensions were on the front burner again, but this time not with China but with the EU, as President Trump and EU President Juncker met and hailed a new phase in trade relations. The White House meeting ended with the following positive joint statement:

“We agree today, first of all, to work together toward zero tariffs, zero non-tariff barriers, and zero subsidies on non-auto industrial goods.”

While negotiations will go on, the outcome was nevertheless presented as a new phase of trade relations with more eliminations of tariffs on the horizon.

Without diving into details, this announcement was all that was needed to power the markets higher with the major indexes gaining solidly as the S&P 500 approached its January highs (2,873). The advances were broad, and not isolated as we’ve seen in the recent past, pushing all of our positions to a green close.

Transportations (IYT) took top billing by sprinting ahead +2.34% followed by the Nasdaq (QQQ) with +1.40%. However, as I am writing this, there is trouble in tech land with Facebook (FB) being in the process of doing a faceplant, with its stock taking a dive (now down -23% and counting). It has officially entered bear market territory as FB’s growth rates continue to decelerate. Ouch!

This will make for an interesting market opening tomorrow with the tech sector appearing to give back possibly more than its hard-fought gains of today. It also goes to show that asset direction can turn on a dime these days, and no event in the markets can be assumed as having any permanence. To me, these are all signs of a topping formation, brought on by an aging bull market, where volatility is a constant companion caused by the latest headline hockey.

Read More

Shrugging Off A Massive Tech Reversal

Ulli Market Commentary Contact

[Chart courtesy of MarketWatch.com]
  1. Moving the markets

Something odd is going on in the markets besides the Chinese Yuan having crashed more in the last 30 days than at anytime in history not counting the 2008 Great Financial Crisis. Yesterday, it was the sudden 10-year bond yield spike to its highest level in 5 months.

Today, it was a huge reversal in the Nasdaq, which had advanced some 1.1% intraday early on to a new record high, but these solid gains evaporated, and the index limped below the unchanged line by -0.01%. Even Google’s “beat” and subsequent rally could not stem the slide. Strangely enough, the Dow and S&P 500 were not affected at all and closed with decent gains.

Transportations (IYT) gave back some of their recent advances, and the Commodity Index (DBC) rallied because of a modestly weaker US Dollar. Activity in the 10-year bond yield slowed down from yesterday’s hectic pace, and the yield perked up 1 basis point to 2.95%.

Volatility and wild unexpected swings in different asset classes appear to be here to stay making me wonder not only as to “who’s next?” but also “will there be spillover effects?” Only time will tell.

Read More