

- Moving the markets
The markets dug a deep hole early in the session only to stage a solid rebound mid-day with the Dow managing to crawl back above the unchanged line, while the S&P fell just short, but the Nasdaq clearly remained in the red by -0.67%. As a result, the Dow has now outperformed the tech sector for the 7th straight day.
Luckily for equities, the bond markets were closed in observance of Columbus Day, so rising bond yields, which were acting as the terminator for stocks last week, had no direct influence during this session, but their shadow clearly hung over the markets.
Other parts of the world were not so lucky. The major stock markets of Europe tumbled into the red with the Europe 500 Stock Index giving back -1.12% and closing at a low last seen in April, while the FTSE took top billing to the downside with -2.43%.
The widely held FANG stocks continued their sideways pattern but have broken below technical levels. The US dollar see-sawed by pumping and dumping but managing to hold on to small gains for the session.
Tomorrow, the bond markets will be open again, and nervousness prevails on Wall Street in anticipation if last week’s yield debacle will continue and thereby affect equities negatively.
- ETFs in the Spotlight
In case you missed the announcement and description of this section, you can read it here again.
It features 10 broadly diversified and sector ETFs from my HighVolume list as posted every Saturday. Furthermore, they are screened for the lowest MaxDD% number meaning they have been showing better resistance to temporary sell offs than all others over the past year.
The below table simply demonstrates the magnitude with which some of the ETFs are fluctuating regarding their positions above or below their respective individual trend lines (%M/A). A break below, represented by a negative number, shows weakness, while a break above, represented by a positive percentage, shows strength.
For hundreds of ETF choices, be sure to reference Thursday’s StatSheet.
Year to date, here’s how our candidates have fared so far:
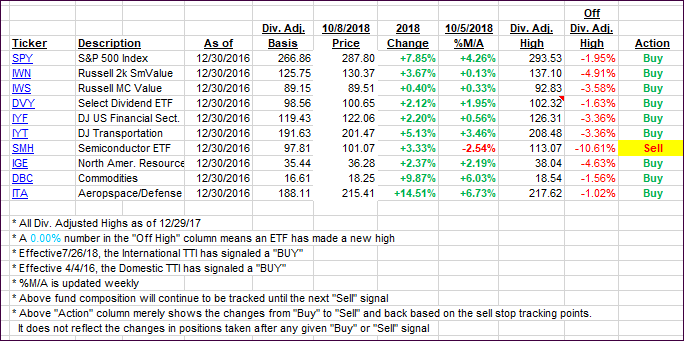
Again, the %M/A column above shows the position of the various ETFs in relation to their respective long-term trend lines, while the trailing sell stops are being tracked in the “Off High” column. The “Action” column will signal a “Sell” once the -8% point has been taken out in the “Off High” column. For more volatile sector ETFs, the trigger point is -10%.
- Trend Tracking Indexes (TTIs)
Our Trend Tracking Indexes (TTIs) were mixed with the Domestic one eking out a small gain, while bearish tendencies were more dominant in the International arena; subsequently the International TTI dropped.
Here’s how we closed 10/08/2018:
Domestic TTI: +3.05% above its M/A (last close +2.92%)—Buy signal effective 4/4/2016
International TTI: -0.29% below its M/A (last close -0.18%)—Buy signal effective 7/26/2018
Disclosure: I am obliged to inform you that I, as well as my advisory clients, own some of the ETFs listed in the above table. Furthermore, they do not represent a specific investment recommendation for you, they merely show which ETFs from the universe I track are falling within the guidelines specified.
Contact Ulli