[Chart courtesy of MarketWatch.com]
- Moving the markets
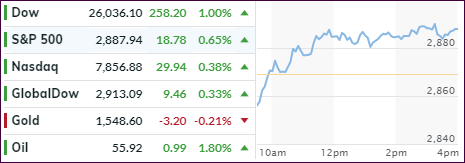
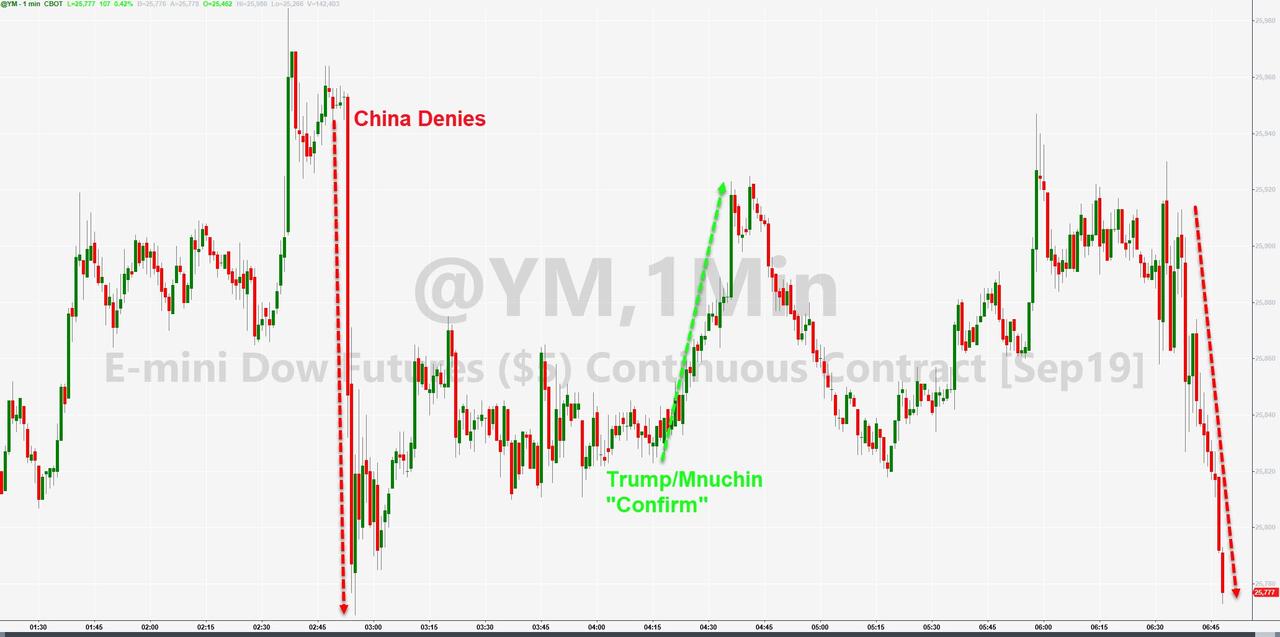
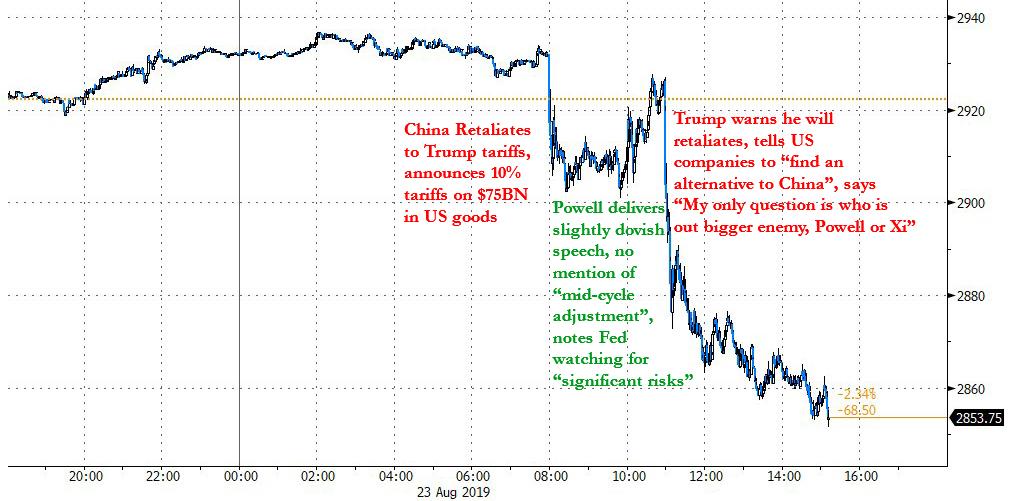
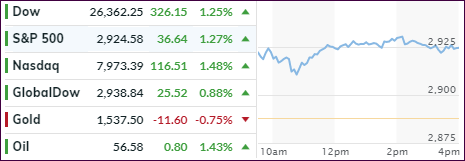
When all else fails, a few well-chosen words seem to be enough these days to put a sagging market back into bullish mode. Such was the case today, when China indicated that they were in no rush to respond to the latest round of tariffs announced by Washington.
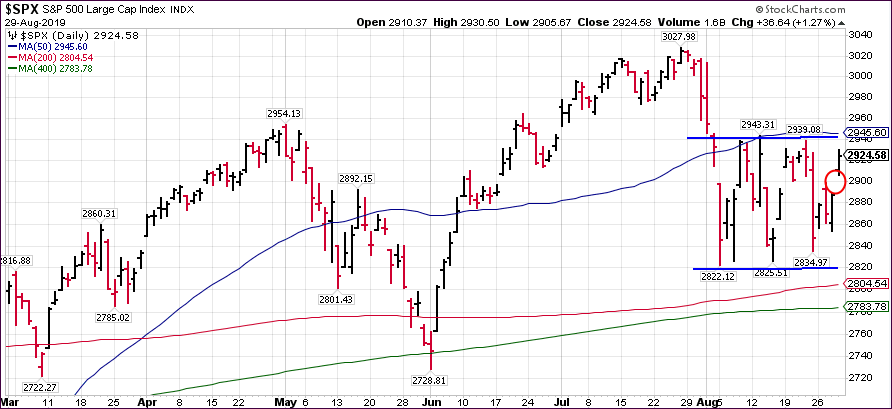
In the process, this week’s rebound has sharply reduced the month-to-date losses for the major indexes. In the case of the S&P 500, the index is now only down -1.85%, while at its worst point, on August 14th, we saw a loss of -4.66%. With tomorrow being the last trading day of the month, we could see another move higher, should positive trade jawboning continue.
However, today’s jump caused an opening gap in the S&P 500 chart (red circle), which eventually must be closed, meaning that the index will retreat to cover that gap. It always happens, it’s just a question of when.
At the same time, the S&P 500 is closing in on the upper range of its current trading band, as I posted yesterday. The above chart shows that level (blue line) at around the 2,945. If pierced, we may very well see an assault of the July highs.
If recent history is an indication, we could bounce off that “glass ceiling” and head back down to the support line, which lies at the 2,820 level. If that is shattered to the downside, a break of the 200-day M/A (red) will come into play, which might have dire consequences in that it would not only bring the June lows into play but also end this current bullish cycle.
Read More