
- Moving the markets
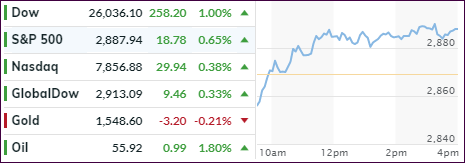
Despite an early sell-off, caused by the bond market flashing a recession signal, the major indexes managed to climb out of that hole supported by a lift from the energy sector, as oil prices showed new signs of life. Even with that good effort, we remain stuck in a trading range with the ceiling of the S&P 500 being in the 2,945 area, while the bottom lurks around 2,820.
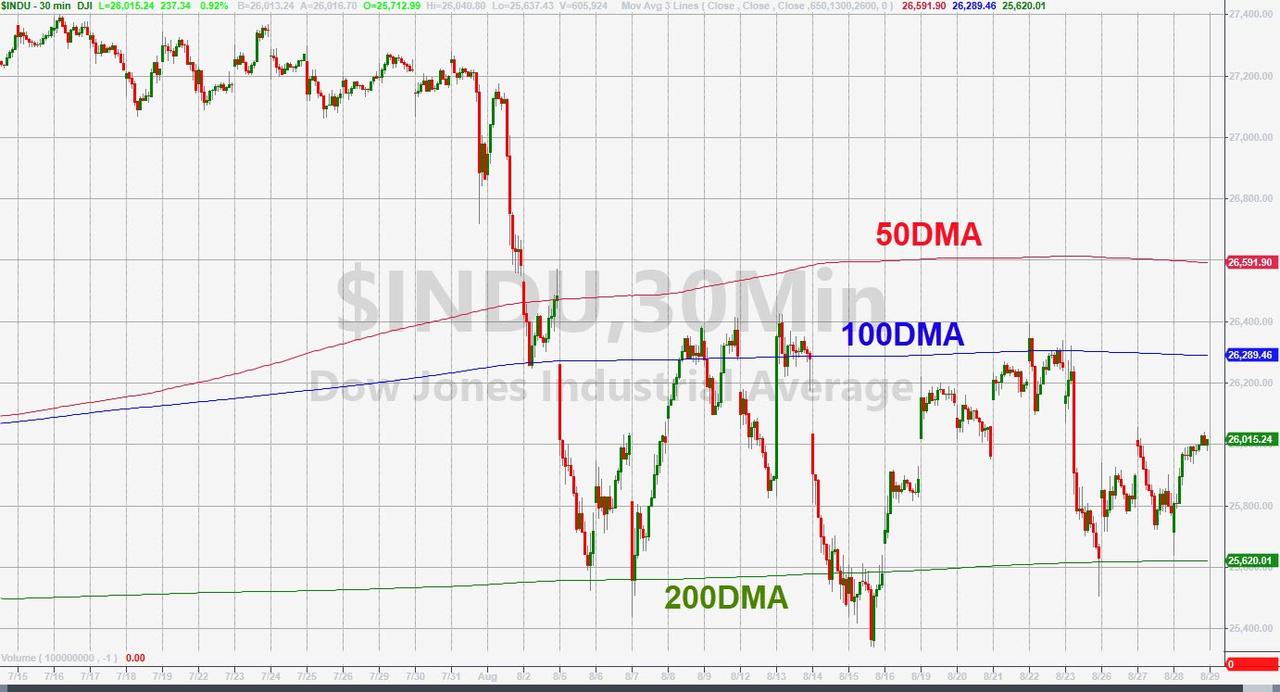
That’s a huge range, in which we’ve been seesawing since early August. A push through the ceiling may bring all-time highs back into play, while a break below the bottom may cause the index to revisit its June lows of 2,728. The Dow as well is rangebound between its 100-day and 200-day M/As.
Better-than-expected earnings from Hewlett Packard and Tiffany helped to fuel the fire and kept the bullish rebound going. The only fly in the ointment was low volume, which is typical for the week ahead of Labor Day.
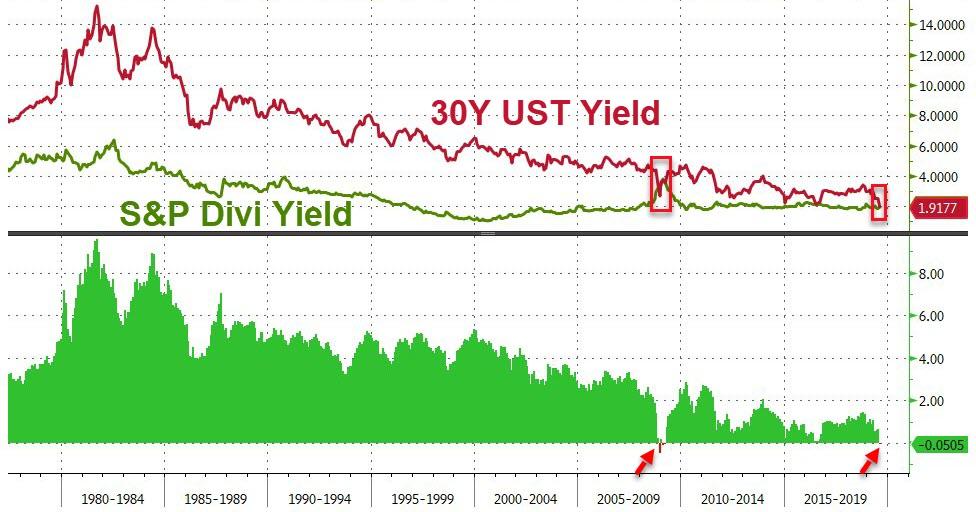
The big news came from the bond market with the 30-year Treasury Bond now yielding less than what the S&P 500 pays in dividends. ZH charted it like this. This is so unusual and has only occurred for about 3 months in the past 40 years.
It confirms that markets continue to be distorted beyond recognition.
2. ETFs in the Spotlight
In case you missed the announcement and description of this section, you can read it here again.
It features 10 broadly diversified and sector ETFs from my HighVolume list as posted every Saturday. Furthermore, they are screened for the lowest MaxDD% number meaning they have been showing better resistance to temporary sell offs than all others over the past year.
The below table simply demonstrates the magnitude with which some of the ETFs are fluctuating regarding their positions above or below their respective individual trend lines (%+/-M/A). A break below, represented by a negative number, shows weakness, while a break above, represented by a positive percentage, shows strength.
For hundreds of ETF choices, be sure to reference Thursday’s StatSheet.
For this current domestic “Buy” cycle, here’s how some our candidates have fared:
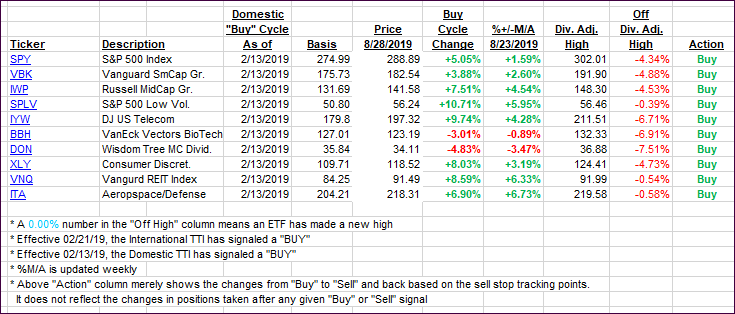
Again, the %+/-M/A column above shows the position of the various ETFs in relation to their respective long-term trend lines, while the trailing sell stops are being tracked in the “Off High” column. The “Action” column will signal a “Sell” once the -8% point has been taken out in the “Off High” column. For more volatile sector ETFs, the trigger point is -10%.
3. Trend Tracking Indexes (TTIs)
Our Trend Tracking Indexes (TTIs) reversed and gained, as the major indexes recovered.
Here’s how we closed 08/28/2019:
Domestic TTI: +1.08% above its M/A (prior close +0.21%)—Buy signal effective 02/13/2019
International TTI: -1.91% below its M/A (prior close -2.24%)—Sell signal effective 08/15/2019
Disclosure: I am obliged to inform you that I, as well as my advisory clients, own some of the ETFs listed in the above table. Furthermore, they do not represent a specific investment recommendation for you, they merely show which ETFs from the universe I track are falling within the specified guidelines.
Contact Ulli