
- Moving the markets
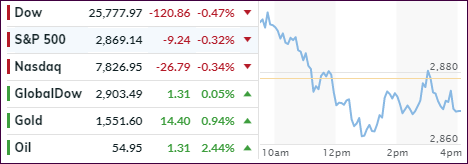
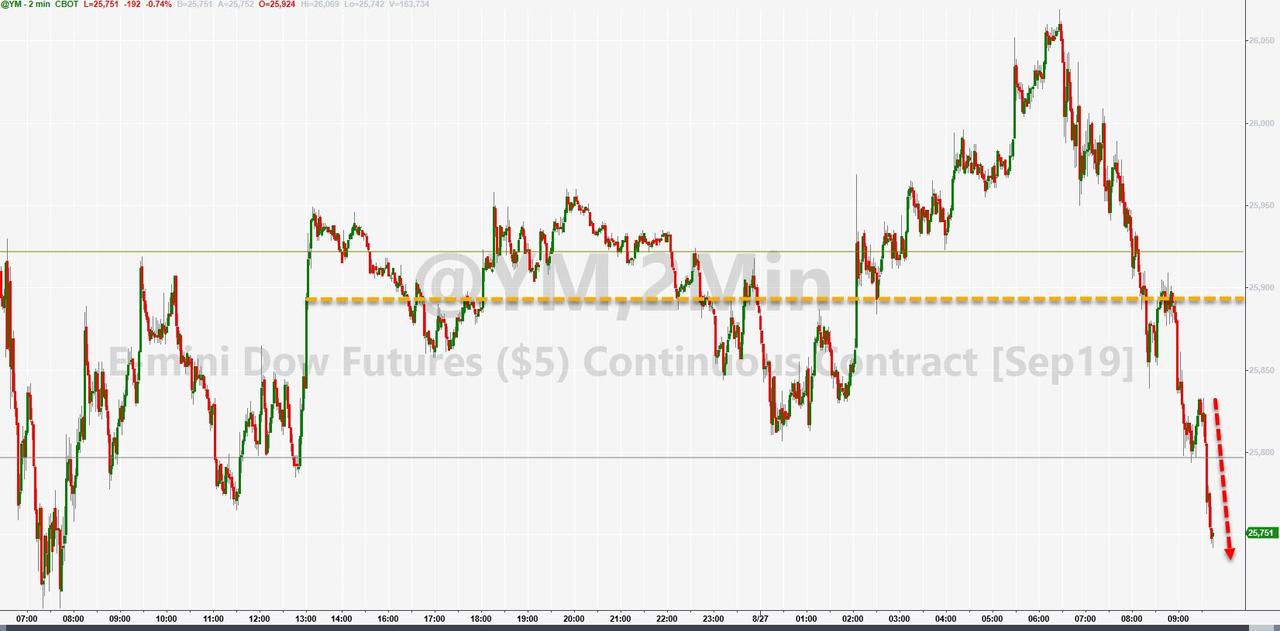
An early follow through rally hit the skids and reversed with the major indexes ending up closing in the red.
It seems that yesterday’s attempt by the White House to try to revive the trade carrot ran out of steam, when China’s Global Times editor signaled that there appears to be no great desire (on their part) to move towards a trade deal any time soon:
“China on Tuesday issued 20 directives to boost consumption, in an effort to further tap domestic market, not putting so much emphasis on trade talks. China’s economy is increasingly driven internally, it’s more and more difficult for the US to press China to make concessions.”
That was enough to take the starch out of equites with the Dow leading the race towards negative territory. It was a seesaw session that is sure to continue, as any potential trade talks are bound to include more saber rattling and will be tumultuous at best.
In economic news, we learned that US home price growth slowed to the weakest in 7 years with the meager MoM rise of 0.04% missing expectations of an 0.1% rise. This now the 15th straight month of YoY declines in price, despite plunging mortgage rates.
It looks like the markets are stuck and are erratically reacting on the latest headline news, which seem to do nothing but support the current roller coaster. A breakout is sure to come sooner or later with the question being “will it be to new highs, or will we head towards bear market territory.”
Stay tuned.
2. ETFs in the Spotlight
In case you missed the announcement and description of this section, you can read it here again.
It features 10 broadly diversified and sector ETFs from my HighVolume list as posted every Saturday. Furthermore, they are screened for the lowest MaxDD% number meaning they have been showing better resistance to temporary sell offs than all others over the past year.
The below table simply demonstrates the magnitude with which some of the ETFs are fluctuating regarding their positions above or below their respective individual trend lines (%+/-M/A). A break below, represented by a negative number, shows weakness, while a break above, represented by a positive percentage, shows strength.
For hundreds of ETF choices, be sure to reference Thursday’s StatSheet.
For this current domestic “Buy” cycle, here’s how some our candidates have fared:
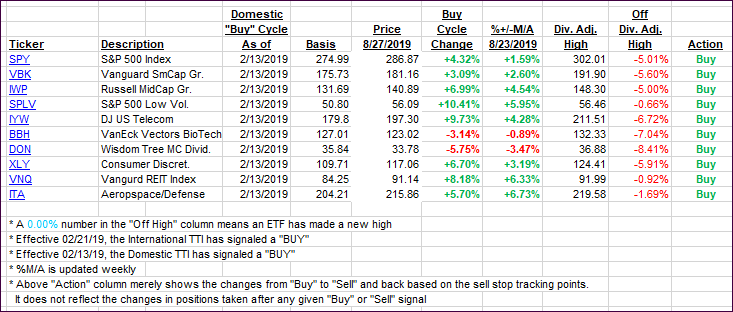
Again, the %+/-M/A column above shows the position of the various ETFs in relation to their respective long-term trend lines, while the trailing sell stops are being tracked in the “Off High” column. The “Action” column will signal a “Sell” once the -8% point has been taken out in the “Off High” column. For more volatile sector ETFs, the trigger point is -10%.
3. Trend Tracking Indexes (TTIs)
Our Trend Tracking Indexes (TTIs) followed the roller coaster ride and slipped. The Domestic one remains barely in bullish territory.
Here’s how we closed 08/27/2019:
Domestic TTI: +0.21% above its M/A (prior close +0.78%)—Buy signal effective 02/13/2019
International TTI: -2.24% below its M/A (prior close -2.28%)—Sell signal effective 08/15/2019
Disclosure: I am obliged to inform you that I, as well as my advisory clients, own some of the ETFs listed in the above table. Furthermore, they do not represent a specific investment recommendation for you, they merely show which ETFs from the universe I track are falling within the specified guidelines.
Contact Ulli