
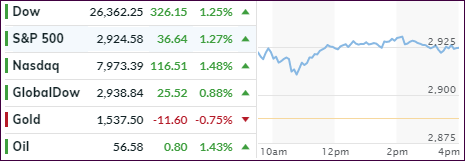
- Moving the markets
When all else fails, a few well-chosen words seem to be enough these days to put a sagging market back into bullish mode. Such was the case today, when China indicated that they were in no rush to respond to the latest round of tariffs announced by Washington.
In the process, this week’s rebound has sharply reduced the month-to-date losses for the major indexes. In the case of the S&P 500, the index is now only down -1.85%, while at its worst point, on August 14th, we saw a loss of -4.66%. With tomorrow being the last trading day of the month, we could see another move higher, should positive trade jawboning continue.
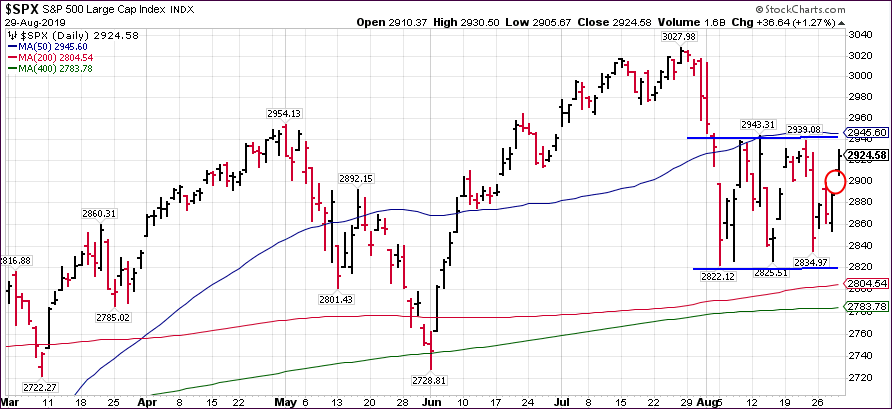
However, today’s jump caused an opening gap in the S&P 500 chart (red circle), which eventually must be closed, meaning that the index will retreat to cover that gap. It always happens, it’s just a question of when.
At the same time, the S&P 500 is closing in on the upper range of its current trading band, as I posted yesterday. The above chart shows that level (blue line) at around the 2,945. If pierced, we may very well see an assault of the July highs.
If recent history is an indication, we could bounce off that “glass ceiling” and head back down to the support line, which lies at the 2,820 level. If that is shattered to the downside, a break of the 200-day M/A (red) will come into play, which might have dire consequences in that it would not only bring the June lows into play but also end this current bullish cycle.
2. ETFs in the Spotlight
In case you missed the announcement and description of this section, you can read it here again.
It features 10 broadly diversified and sector ETFs from my HighVolume list as posted every Saturday. Furthermore, they are screened for the lowest MaxDD% number meaning they have been showing better resistance to temporary sell offs than all others over the past year.
The below table simply demonstrates the magnitude with which some of the ETFs are fluctuating regarding their positions above or below their respective individual trend lines (%+/-M/A). A break below, represented by a negative number, shows weakness, while a break above, represented by a positive percentage, shows strength.
For hundreds of ETF choices, be sure to reference Thursday’s StatSheet.
For this current domestic “Buy” cycle, here’s how some our candidates have fared:
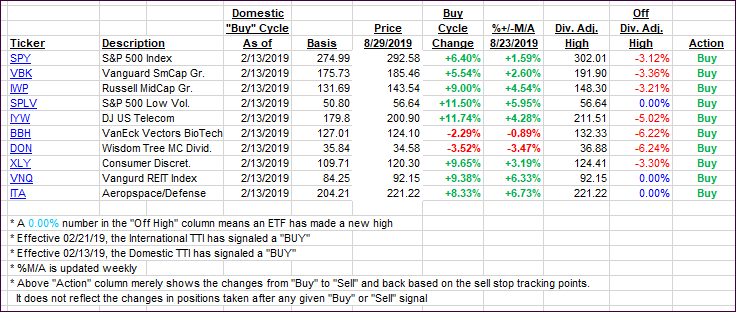
Again, the %+/-M/A column above shows the position of the various ETFs in relation to their respective long-term trend lines, while the trailing sell stops are being tracked in the “Off High” column. The “Action” column will signal a “Sell” once the -8% point has been taken out in the “Off High” column. For more volatile sector ETFs, the trigger point is -10%.
3. Trend Tracking Indexes (TTIs)
Our Trend Tracking Indexes (TTIs) jumped, but the International one still remains in bear market territory.
Here’s how we closed 08/29/2019:
Domestic TTI: +2.45% above its M/A (prior close +1.08%)—Buy signal effective 02/13/2019
International TTI: -1.05% below its M/A (prior close -1.91%)—Sell signal effective 08/15/2019
Disclosure: I am obliged to inform you that I, as well as my advisory clients, own some of the ETFs listed in the above table. Furthermore, they do not represent a specific investment recommendation for you, they merely show which ETFs from the universe I track are falling within the specified guidelines.
Contact Ulli