
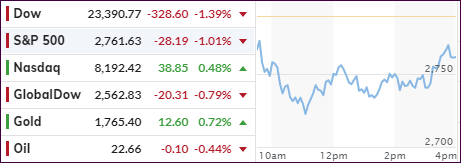
- Moving the markets
In case you missed it or got confused by last week’s efforts by the Fed to rescue the markets via an alphabet soup of emergency measures, analyst and author Graham Summers put together an easy to understand summary:
On Thursday the Fed announced a $2.3 trillion (with a “T”) monetary program.
In its simplest rendering, the Fed announced it would expand its current Quantitative Easing (QE) programs for municipal bonds, asset backed securities, and investment grade corporate debt. The Fed also announced it would begin buying junk bonds for the first time in history.
Thus, the Fed is now intervening directly in:
1) The Treasury markets.
2) The municipal bond markets.
3) The corporate bond markets (both investment grade and junk).
4) The commercial paper markets (short-term corporate debt market).
5) The asset backed security market (everything from student loans to Certificates of Deposit and more).
At this point the only asset classes the Fed isn’t buying outright via a QE program are stocks and commodities. It is, however, worth noting that the Fed is buying bond Exchange Traded Funds or ETFs which trade on the stock market just like regular stocks.
Again, the Fed has effectively nationalized the U.S. debt markets. All in the span of just six weeks.
It is almost impossible to express the insanity of this. Perhaps the easiest way would be to say the Fed just printed the GDP of Brazil in last six weeks and is planning on printing the GDP of France in the next six weeks.
The multitrillion dollar question now is if this will stop the meltdown triggered by the economic shutdown in the U.S.
Of course, it is possible that these monetary efforts will stoke the market fire for a while, but the durations of it is questionable. As trend followers, we are less concerned with the “why’s” of a rally but more so that it penetrates our dividing line between bullish and bearish territory not only to the upside but also by a clear margin.
That would signal a new “Buy” for domestic equity ETFs, however, the duration of which is always an unknown. Right now, we have a way to go before such a signal will materialize, as you can see in section 3 below.
My point simply is that the newly created trillions of dollars could certainly drive equities against all fundamental valuations to a point of creating a new bullish theme for us. The recent stimulus has helped the markets bounce off their recent lows by an amazing 25%, despite some of the worst economic settings. This TV screenshot makes this abundantly clear.
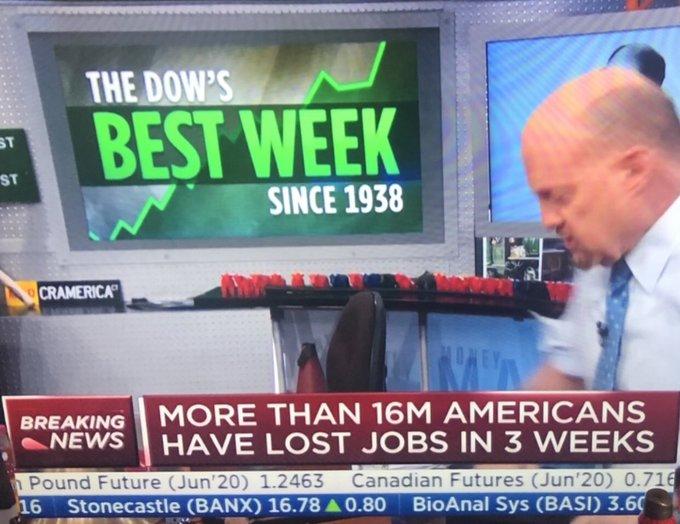
Tumbling into another week best describes today’s action with the question in my mind being this one: Can the Fed and its continued stimulus efforts offset what is sure to be a miserable upcoming earnings season?
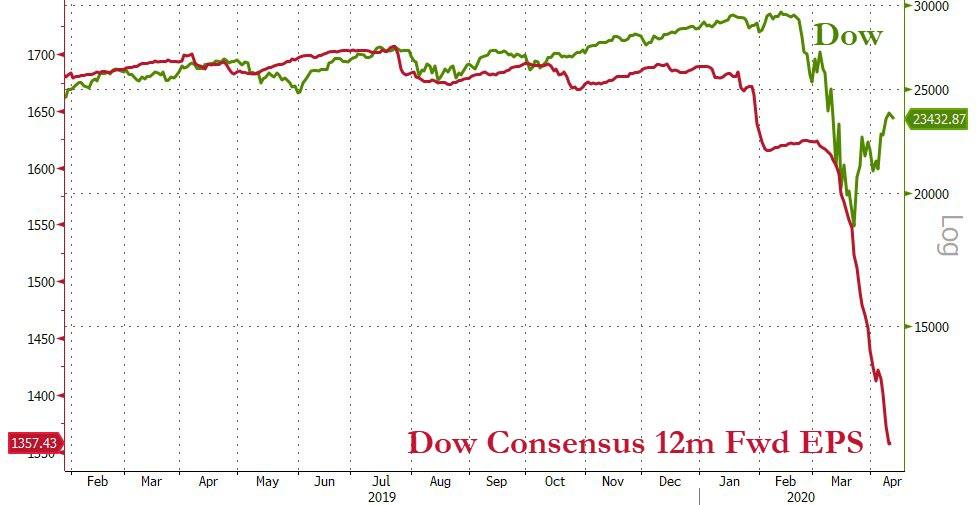
2. ETFs in the Spotlight
In case you missed the announcement and description of this section, you can read it here again.
It features some of the 10 broadly diversified domestic and sector ETFs from my HighVolume list as posted every Saturday. Furthermore, they are screened for the lowest MaxDD% number meaning they have been showing better resistance to temporary sell offs than all others over the past year.
The below table simply demonstrates the magnitude with which these ETFs are fluctuating above or below their respective individual trend lines (%+/-M/A). A break below, represented by a negative number, shows weakness, while a break above, represented by a positive percentage, shows strength.
For hundreds of ETF choices, be sure to reference Thursday’s StatSheet.
For this past domestic “Buy” cycle, which ended on 2/27/2020, here’s how some our candidates have fared:
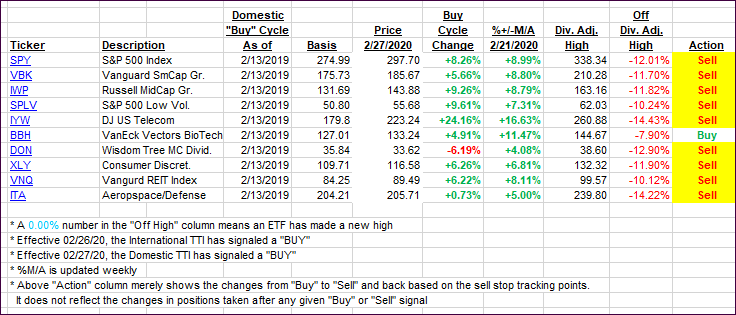
Click image to enlarge
Again, the %+/-M/A column above shows the position of the various ETFs in relation to their respective long-term trend lines, while the trailing sell stops are being tracked in the “Off High” column. The “Action” column will signal a “Sell” once the -8% point has been taken out in the “Off High” column. For more volatile sector ETFs, the trigger point is -10%.
In my advisor practice, we may or may not be invested in some of the 10 ETFs listed above.
3. Trend Tracking Indexes (TTIs)
Our TTIs slipped with the major indexes tumbling with earnings season on deck.
Here’s how we closed 04/13/2020:
Domestic TTI: -14.85% below its M/A (prior close -12.98%)—Sell signal effective 02/27/2020
International TTI: -15.08% below its M/A (prior close -14.46%)—Sell signal effective 02/26/2020
Disclosure: I am obliged to inform you that I, as well as my advisory clients, own some of the ETFs listed in the above table. Furthermore, they do not represent a specific investment recommendation for you, they merely show which ETFs from the universe I track are falling within the specified guidelines.
Contact Ulli