
- Moving the markets
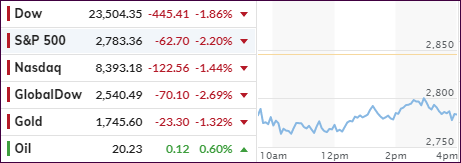
Even the news scanning computer algos could not prevent an early market dump, as a variety of headlines confirmed what had been feared most, namely, an economic breakdown in a variety of sectors.
Here’s a random capture of titles that caught my attention:
- Homebuilder Sentiment Collapses As Mortgage Purchase Apps Plunge To Lowest In 5 Years
- US Industrial Production Crashes By Most Since End Of World War II
- Retail Icon JC Penney Prepares To File For Bankruptcy Protection
- Empire State Manufacturing Crashes Most Ever To -78, Lowest In History
- US Retail Sales Crash By Most Ever In March, Despite Hoarding
- BofA Profit Plunges 45% On $4.8 Billion In Expected Credit Losses
- JPM Sees Global Profits “Cratering” 70% In Q2
- Over 25% of Michigan Workforce Filed For Unemployment
Given that, you might have expected the Dow, as well as the markets in general, to plunge a multiple of what it did early on, but no, we saw a rebound late in the session recouping some of the early losses and closing this day only mildly in the red.
Economist Jason Thomas acknowledged some of the reality and summed it up like this:
“I think we’re in for a very rough time in the markets for the next couple of months, we are just now starting to get hard data, but it’s for March. What we are living through in April is much worse.”
Yes it is, but in regards to markets, the Fed has made it very clear that there are to be no losers—or at least that one does not have to bother trying to pick winners, an attitude that even the trillion dollar giant Blackrock has adopted:
“We will follow the Fed and other central banks by purchasing what they’re purchasing, and assets that rhyme with those.”
With so much market idiocy going on, I liked ZeroHege’s conclusion:
Of course, this state of affairs works… until it doesn’t, as the USSR demonstrated so vividly:
How much further can we take the dichotomy of bull markets as we head to 10%, 15%, or perhaps 25% unemployment? Let’s test the structure in a teleological manner. Can everyone lose their jobs or be paid to do nothing, and all activity stop except that of the government, but everything still remains happy in markets, because the Fed will just keep setting the price of assets? I believe we tried that from the 1930s up to 1991 (“We pretend to work, and they pretend to pay us”), and it didn’t work out so well for those on the receiving end of it.
2. ETFs in the Spotlight
In case you missed the announcement and description of this section, you can read it here again.
It features some of the 10 broadly diversified domestic and sector ETFs from my HighVolume list as posted every Saturday. Furthermore, they are screened for the lowest MaxDD% number meaning they have been showing better resistance to temporary sell offs than all others over the past year.
The below table simply demonstrates the magnitude with which these ETFs are fluctuating above or below their respective individual trend lines (%+/-M/A). A break below, represented by a negative number, shows weakness, while a break above, represented by a positive percentage, shows strength.
For hundreds of ETF choices, be sure to reference Thursday’s StatSheet.
For this past domestic “Buy” cycle, which ended on 2/27/2020, here’s how some our candidates have fared:
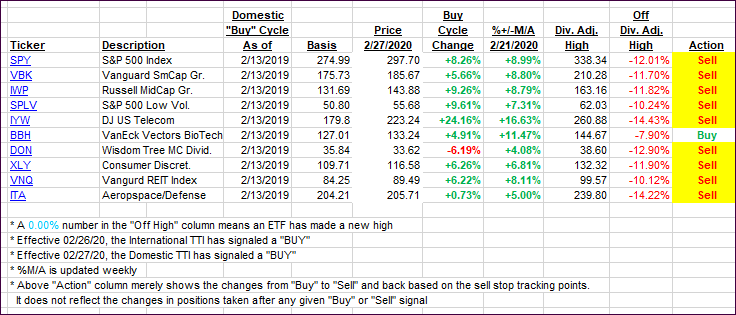
Click image to enlarge
Again, the %+/-M/A column above shows the position of the various ETFs in relation to their respective long-term trend lines, while the trailing sell stops are being tracked in the “Off High” column. The “Action” column will signal a “Sell” once the -8% point has been taken out in the “Off High” column. For more volatile sector ETFs, the trigger point is -10%.
In my advisor practice, we may or may not be invested in some of the 10 ETFs listed above.
3. Trend Tracking Indexes (TTIs)
Our TTIs headed south again, as plummeting econ data proved impossible for the bulls to overcome.
Here’s how we closed 04/15/2020:
Domestic TTI: -15.42% below its M/A (prior close -12.60%)—Sell signal effective 02/27/2020
International TTI: -15.81% below its M/A (prior close -13.44%)—Sell signal effective 02/26/2020
Disclosure: I am obliged to inform you that I, as well as my advisory clients, own some of the ETFs listed in the above table. Furthermore, they do not represent a specific investment recommendation for you, they merely show which ETFs from the universe I track are falling within the specified guidelines.
Contact Ulli