
Jobless Claims Soar—Markets Dump And Pump
- Moving the markets
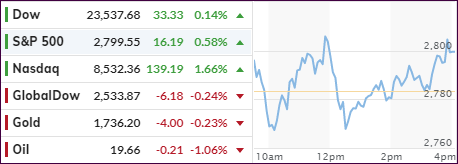
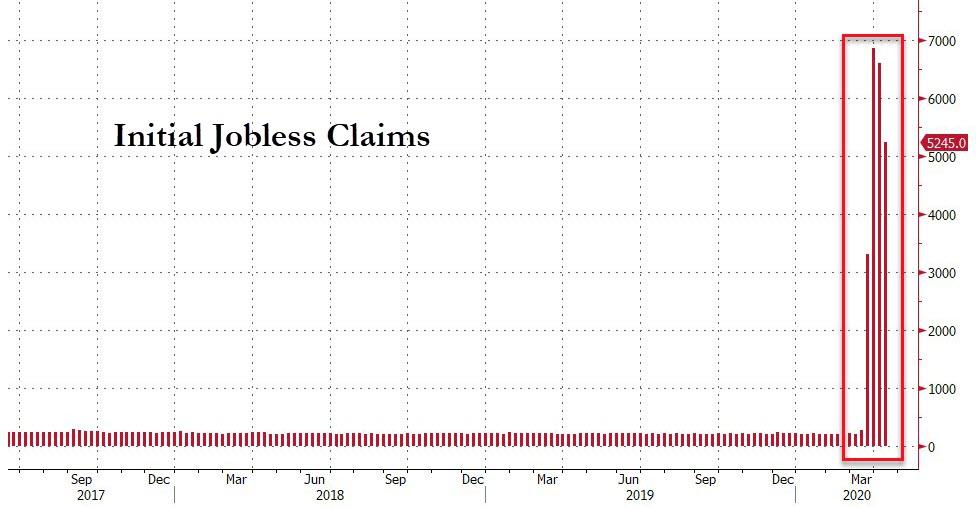
The major indexes went on another roller coaster ride but managed to eke out a green close. Today’s jobless numbers were almost as bad as last week’s with 5.245 million new filings for unemployment benefits, but at least this was in line with expectations.
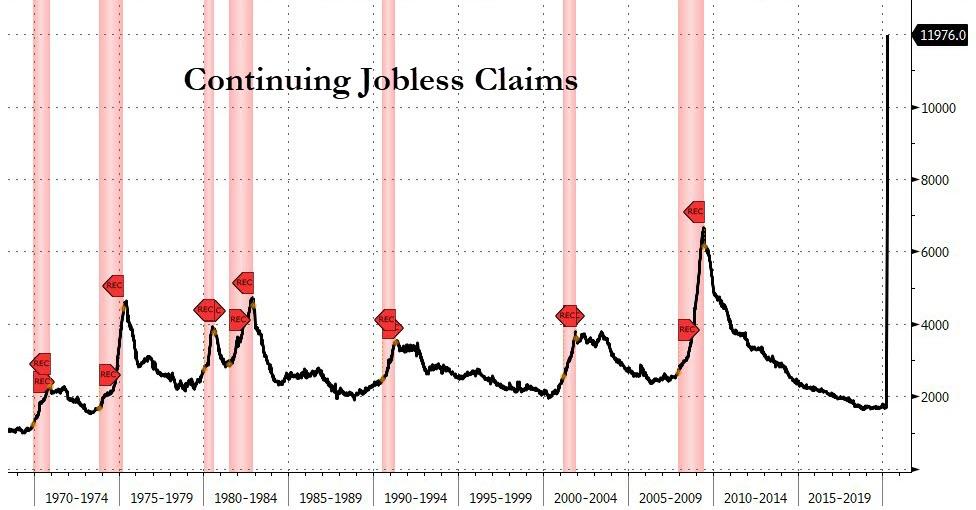
However, when looking at the big picture, this means that, as ZeroHedge explains, the four-week total is now up to 22.025 million, which is over 10 times the prior worst four-week period in the last 50-plus years. Subsequently, the last week’s “initial” and this week’s “continuing” claims are at the highest level as per Bloomberg’s chart.
We will have to wait and see what this will do to the unemployment rate, but early forecasts point to a range of 17-20%.
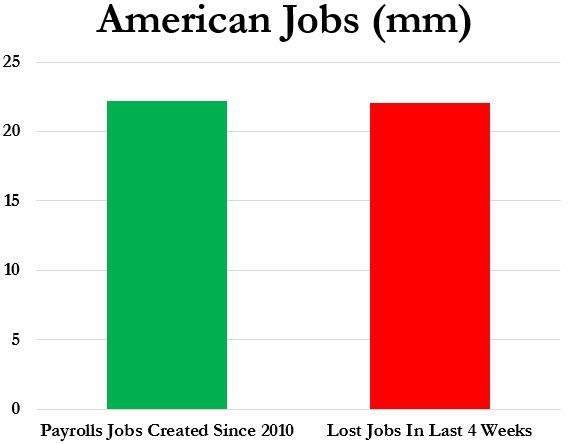
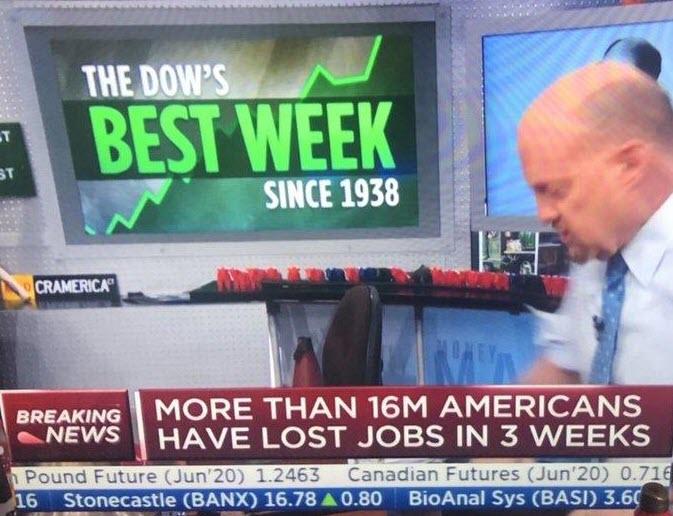
What’s most concerting, however, is that in the last four weeks, more Americans have filed for unemployment than jobs gained during the last decade since the end of the Great Recession (22.13 million gained in a decade, 22.025 million lost in 4 weeks.)
While the markets tumbled early on, hope prevailed that U.S. and European leaders will begin reopening their economies, although I think that will be slow process. Initially markets may jump at that fact, once it happens, but possibly head south again, as reality sets in that a V-shape type of recovery will not be in the cards and the actual upturn will be anything but speedy.
As Bloomberg points out, Macro Economic data took a steep dive and earnings expectations are collapsing, a serious issue, which so far has been conveniently overlooked by computer algos and traders alike. These things don’t seem to matter, until one day they do.
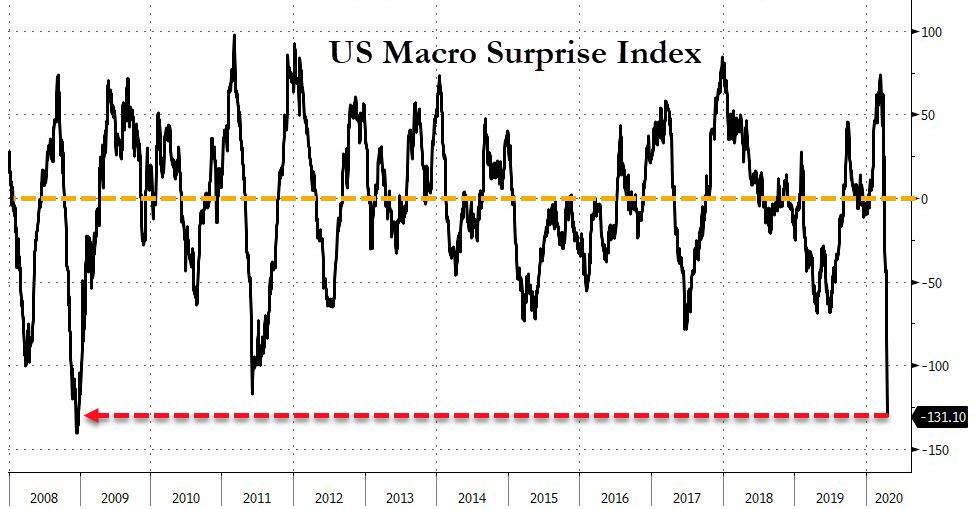
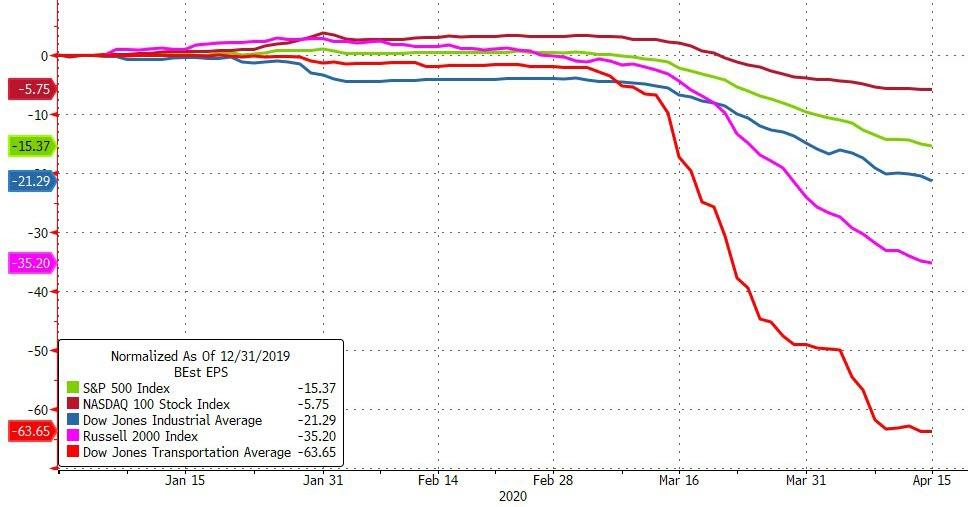
To confirm that fundamentals no longer matter, ZeroHedge noted:
Over the last four weeks, on days the initial jobless claims data has been released and Americans have lost over 22 million jobs, the S&P 500 has actually rallied (+6.2%, +2.3%, +1.4%, and +0.6%), and Nasdaq 100 (+5.72%, +1.99%, +0.11%, and +2.0%).
Does that make sense to you?
2. ETFs in the Spotlight
In case you missed the announcement and description of this section, you can read it here again.
It features some of the 10 broadly diversified domestic and sector ETFs from my HighVolume list as posted every Saturday. Furthermore, they are screened for the lowest MaxDD% number meaning they have been showing better resistance to temporary sell offs than all others over the past year.
The below table simply demonstrates the magnitude with which these ETFs are fluctuating above or below their respective individual trend lines (%+/-M/A). A break below, represented by a negative number, shows weakness, while a break above, represented by a positive percentage, shows strength.
For hundreds of ETF choices, be sure to reference Thursday’s StatSheet.
For this past domestic “Buy” cycle, which ended on 2/27/2020, here’s how some our candidates have fared:
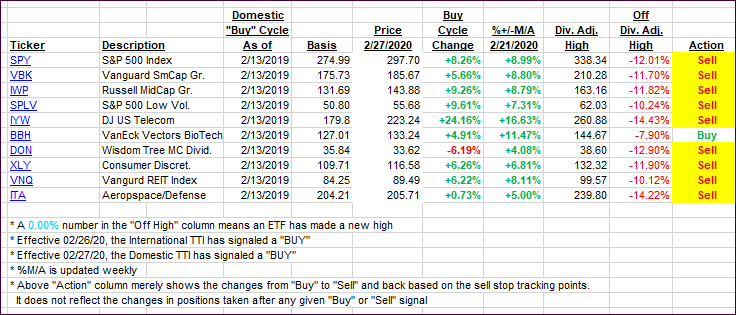
Click image to enlarge
Again, the %+/-M/A column above shows the position of the various ETFs in relation to their respective long-term trend lines, while the trailing sell stops are being tracked in the “Off High” column. The “Action” column will signal a “Sell” once the -8% point has been taken out in the “Off High” column. For more volatile sector ETFs, the trigger point is -10%.
In my advisor practice, we may or may not be invested in some of the 10 ETFs listed above.
3. Trend Tracking Indexes (TTIs)
Our TTIs headed barely changed as markets remained stuck in a sideways pattern.
This is how we closed 04/16/2020:
Domestic TTI: -15.42% below its M/A (prior close -15.42%)—Sell signal effective 02/27/2020
International TTI: -16.05% below its M/A (prior close -15.81%)—Sell signal effective 02/26/2020
Disclosure: I am obliged to inform you that I, as well as my advisory clients, own some of the ETFs listed in the above table. Furthermore, they do not represent a specific investment recommendation for you, they merely show which ETFs from the universe I track are falling within the specified guidelines.
Contact Ulli