
- Moving the markets
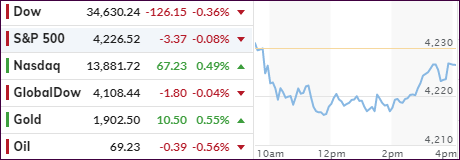
The Dow and S&P 500 lost their early upward impetus and slid most of the day besides not being able to pierce overhead resistance, despite hovering within striking distance of new all-time highs. For a change, the Nasdaq showed more strength and ended the session moderately to the upside.
Some analysts see the economic recovery as well-balanced, but only as long as signs of rising inflation are interpreted by the Fed to be “transitory.” I do not share that transitory viewpoint, because inflation potential, once unleashed to the degree it has, will not suddenly disappear on its own.
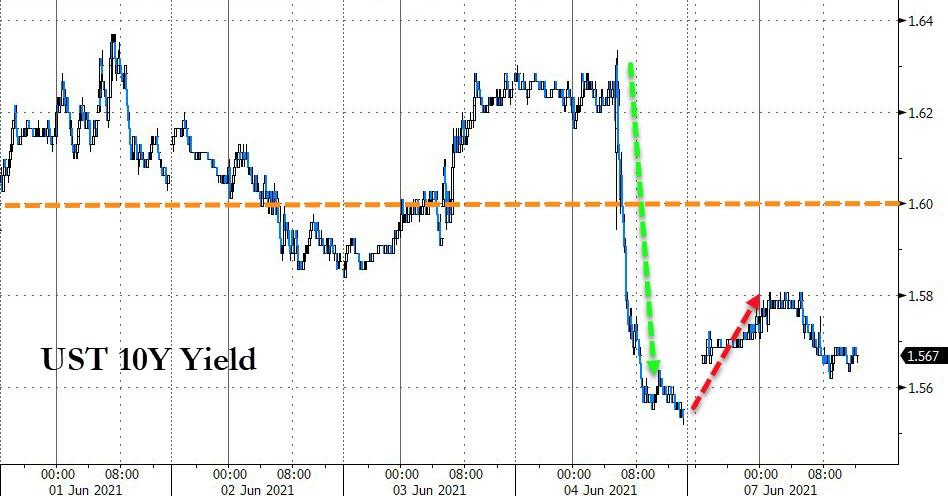
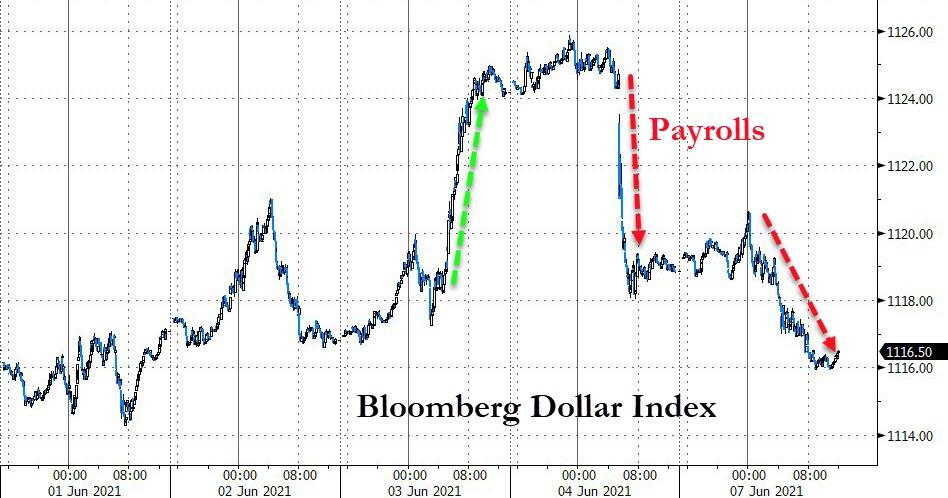
For today, however, the Biotech sector took top billing, while the broader market was treading water. The 10-year bond yield pumped and dumped and ended in proximity of where it started. The US Dollar index continued Friday’s slide, which allowed Gold to build on recent gains and break back above its $1,900 level, supported by a +0.56% gain.
The big dog on deck will be Thursday’s CPI release, which DB’s Jim Reid explains as follows:
Consensus estimates for May currently expect both the headline and core rate to rise +0.4% month-on-month which would lift the YoY rate to 4.7% and 3.4% respectively, which will be the highest since late 2008 and 1993 which would be a pretty impressive feat especially on the core. This will undoubtedly be the most watched data release this year so far.
For sure, these are numbers that can’t be ignored forever and eventually will unearth a response from the Fed that may not be market friendly.
2. ETFs in the Spotlight
In case you missed the announcement and description of this section, you can read it here again.
It features some of the 10 broadly diversified domestic and sector ETFs from my HighVolume list as posted every Saturday. Furthermore, they are screened for the lowest MaxDD% number meaning they have been showing better resistance to temporary sell offs than all others over the past year.
The below table simply demonstrates the magnitude with which these ETFs are fluctuating above or below their respective individual trend lines (%+/-M/A). A break below, represented by a negative number, shows weakness, while a break above, represented by a positive percentage, shows strength.
For hundreds of ETF choices, be sure to reference Thursday’s StatSheet.
For this current domestic “Buy” cycle, here’s how some our candidates have fared:
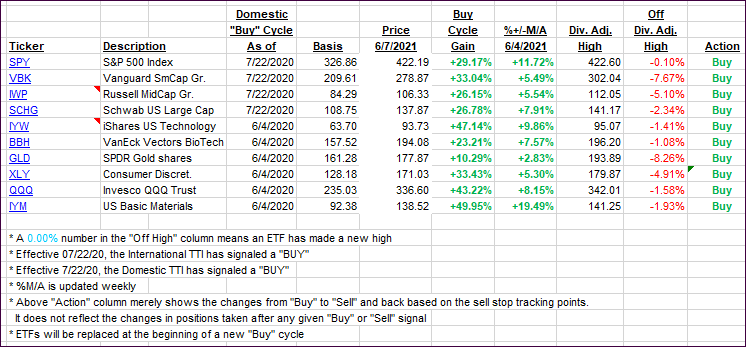
Click image to enlarge.
Again, the %+/-M/A column above shows the position of the various ETFs in relation to their respective long-term trend lines, while the trailing sell stops are being tracked in the “Off High” column. The “Action” column will signal a “Sell” once the -8% point has been taken out in the “Off High” column. For more volatile sector ETFs, the trigger point is -10%.
3. Trend Tracking Indexes (TTIs)
Our TTIs dipped a little with the broad market treading water.
This is how we closed 06/07/2021:
Domestic TTI: +16.73% above its M/A (prior close +16.93%)—Buy signal effective 07/22/2020.
International TTI: +15.77% above its M/A (prior close +15.85%)—Buy signals effective 07/22/2020.
Disclosure: I am obliged to inform you that I, as well as my advisory clients, own some of the ETFs listed in the above table. Furthermore, they do not represent a specific investment recommendation for you, they merely show which ETFs from the universe I track are falling within the specified guidelines.
All linked charts above are courtesy of Bloomberg via ZeroHedge.
Contact Ulli