
- Moving the markets
Despite consumer prices accelerating at their fastest pace since mid-2008, with the Consumer Price Index (CPI) rising 5% YoY, you would not have known that by today’s market reaction. Apparently, the investment crowd has bought the theme spewed about by the Fed that inflation is or will be “transitory.”
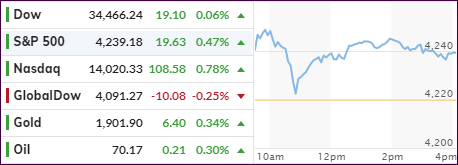
The markets shrugged off any inflation concerns, and the S&P 500 promptly scored another intra-day record by touching the 4,249 level before pulling back into the close. All three major indexes, despite bobbing and weaving all day, recovered from an early dip, and closed in the green led by the Nasdaq with a +0.78% gain.
Today’s flip-flopping pattern included Small Caps, which eked out a gain after an early drop with VBK adding +0.57%, while the value based RPV slid again and gave back -0.87%, but YTD, the latter remains the king of the hill.
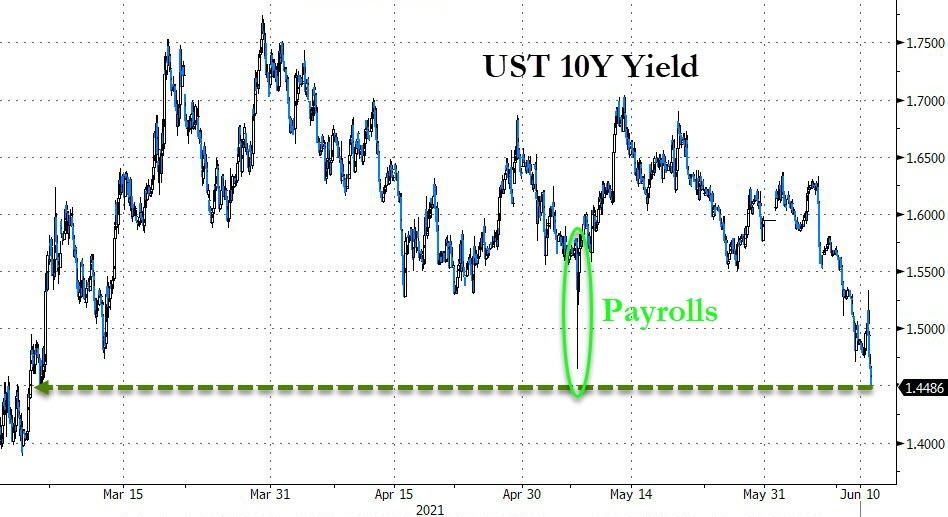
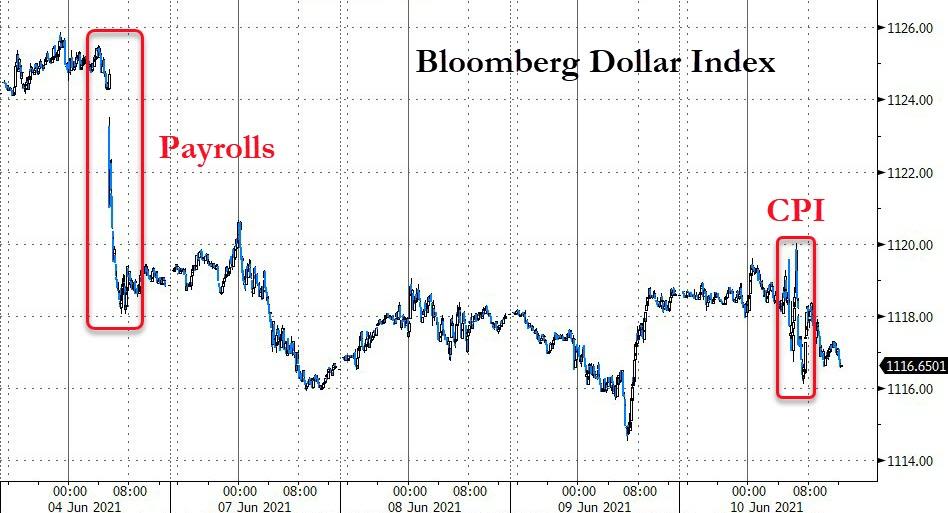
Interestingly, in light of the surging CPI number, bond yields slid with the 10-year down below the 1.5% level, at 1.45%, thereby touching its lowest point since March 14. The US Dollar Index pumped and dumped all day and ending the session lower.
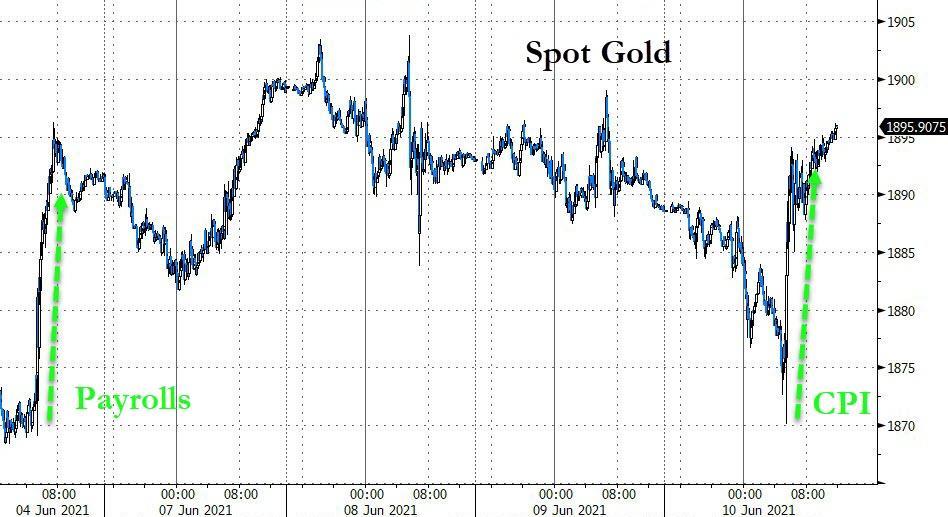
Needless to say, the CPI number gave an assist to Gold, which rallied a modest +0.30% but was not able to recapture its $1,900 level.
Added ZeroHedge:
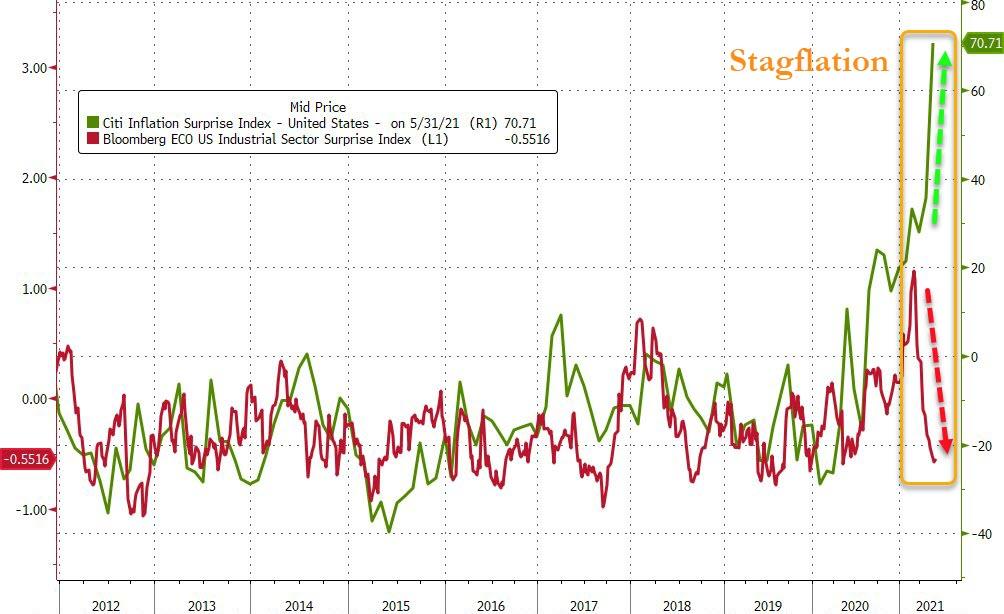
Today’s big upside inflation surprise piles on the stagflationary evidence as production expectations remain too optimistic…
This chart makes this abundantly clear.
2. ETFs in the Spotlight
In case you missed the announcement and description of this section, you can read it here again.
It features some of the 10 broadly diversified domestic and sector ETFs from my HighVolume list as posted every Saturday. Furthermore, they are screened for the lowest MaxDD% number meaning they have been showing better resistance to temporary sell offs than all others over the past year.
The below table simply demonstrates the magnitude with which these ETFs are fluctuating above or below their respective individual trend lines (%+/-M/A). A break below, represented by a negative number, shows weakness, while a break above, represented by a positive percentage, shows strength.
For hundreds of ETF choices, be sure to reference Thursday’s StatSheet.
For this current domestic “Buy” cycle, here’s how some our candidates have fared:
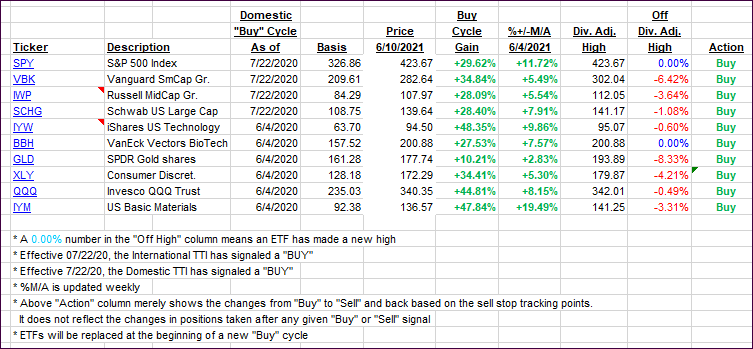
Click image to enlarge.
Again, the %+/-M/A column above shows the position of the various ETFs in relation to their respective long-term trend lines, while the trailing sell stops are being tracked in the “Off High” column. The “Action” column will signal a “Sell” once the -8% point has been taken out in the “Off High” column. For more volatile sector ETFs, the trigger point is -10%.
3. Trend Tracking Indexes (TTIs)
Our TTIs eked out some small gains as the markets flip-flopped throughout the session.
This is how we closed 06/10/2021:
Domestic TTI: +16.57% above its M/A (prior close +16.35%)—Buy signal effective 07/22/2020.
International TTI: +15.28% above its M/A (prior close +15.09%)—Buy signals effective 07/22/2020.
Disclosure: I am obliged to inform you that I, as well as my advisory clients, own some of the ETFs listed in the above table. Furthermore, they do not represent a specific investment recommendation for you, they merely show which ETFs from the universe I track are falling within the specified guidelines.
All linked charts above are courtesy of Bloomberg via ZeroHedge.
Contact Ulli