
- Moving the markets
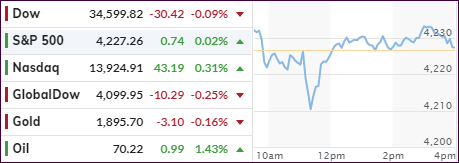
An early upswing for the major indexes ran out of steam mid-morning with all three of them plunging into the red. This dip below the unchanged line did not last very long, and a slow but steady recovery pulled the indexes out of that early hole and back into green territory.
However, only the Nasdaq managed a noteworthy recovery of +0.31%, while the other two more or less ended up hugging their flat lines. Not much gained and not much lost sums up this session best, as the S&P continues to hover near its record close.
On the economic front, we learned that job openings in April rose to a new record high showing an amazing 9.3 million vacancies, as high numbers quit their jobs contributing to the supply-demand mismatch resulting from overly generous unemployment benefits.
Added ZeroHedge:
Separately, in yet another indication of the record surge in demand for labor since the collapse last April when there were 18.1 million more unemployed workers than there are job openings – the biggest gap on record – the gap has since shrunk dramatically to just 526K in April, down from 1.4 million in March. Yes: despite the covid shock, there are just half a million more unemployed people than there are job openings!
How this is going to end is anyone’s guess, but it is sad situation in this environment that firms are having a hard time filling open positions. On the other hand, what do you expect when people get paid more staying at home than going to work?
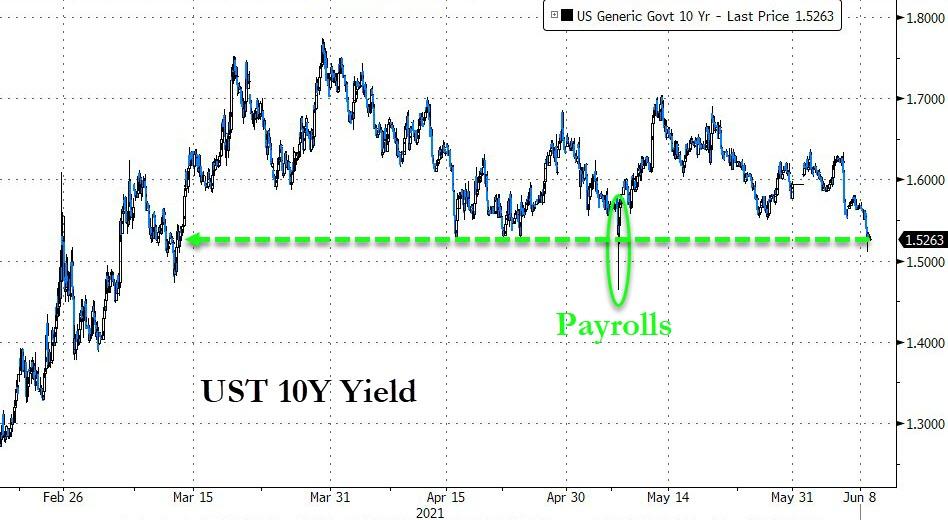
While the tech sector moved moderately higher, this day belonged to Small Caps with VBK adding a solid +1.17% thereby outperforming the rest of the space. Bond yields retreated with the 10-year closing at 1.54%, its lowest since March.
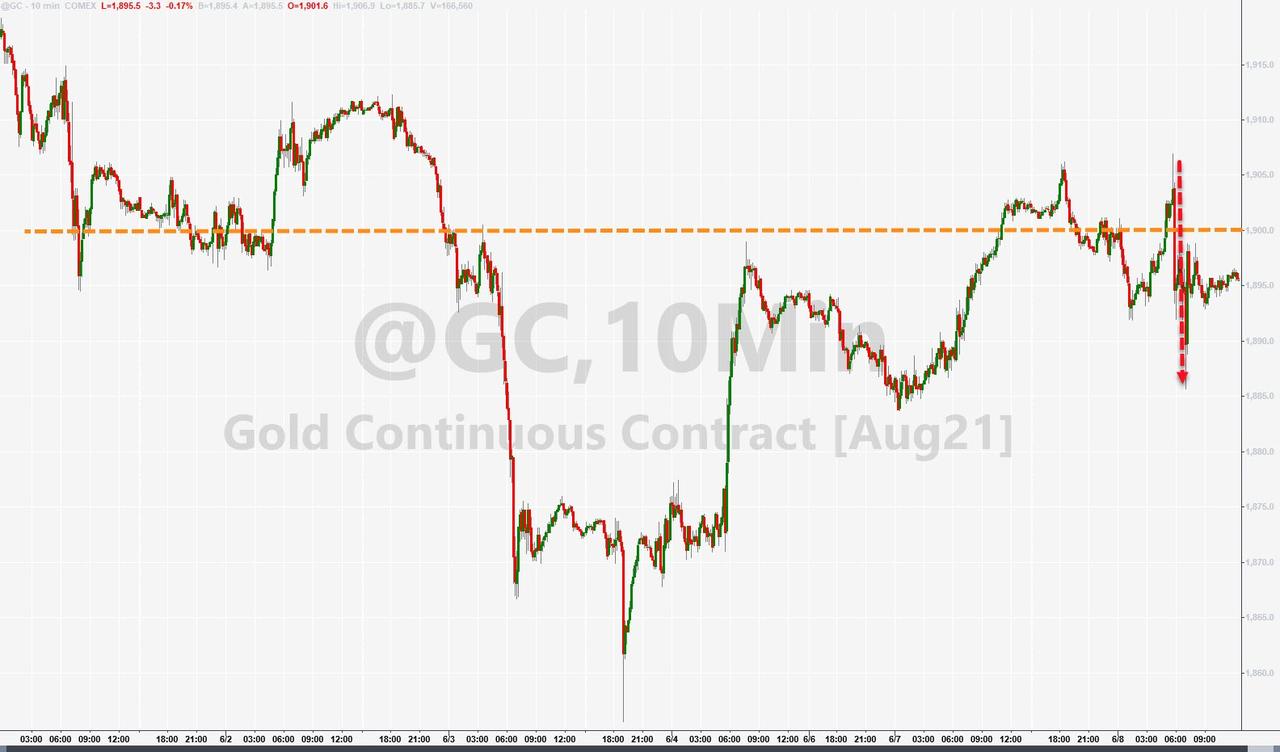
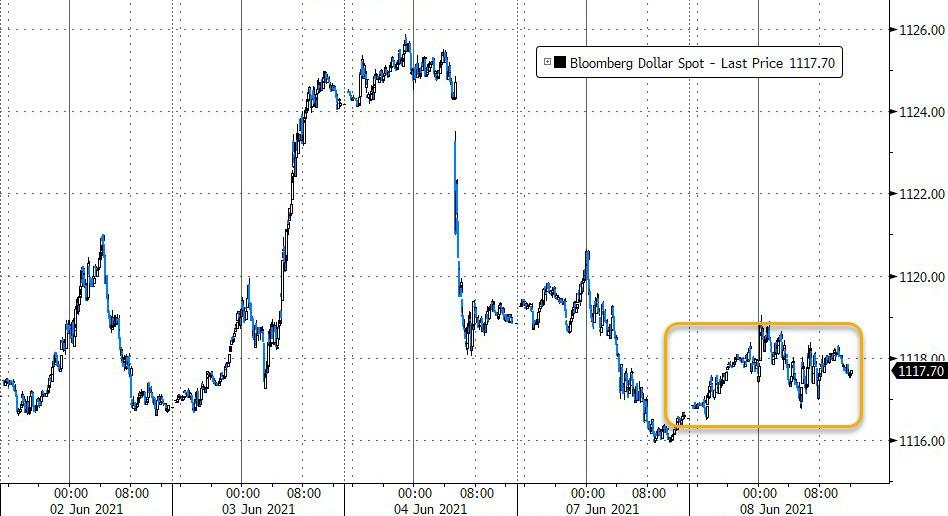
While that should have assisted Gold, it did not, as the US Dollar found some upward momentum and gained a moderate 0.18%.
Mused ZeroHedge:
Finally, we wonder just what will happen when all these couch-sitters actually run out of benefits? Record job openings… and near-record people soaking up government handouts rather than apply for a job.
2. ETFs in the Spotlight
In case you missed the announcement and description of this section, you can read it here again.
It features some of the 10 broadly diversified domestic and sector ETFs from my HighVolume list as posted every Saturday. Furthermore, they are screened for the lowest MaxDD% number meaning they have been showing better resistance to temporary sell offs than all others over the past year.
The below table simply demonstrates the magnitude with which these ETFs are fluctuating above or below their respective individual trend lines (%+/-M/A). A break below, represented by a negative number, shows weakness, while a break above, represented by a positive percentage, shows strength.
For hundreds of ETF choices, be sure to reference Thursday’s StatSheet.
For this current domestic “Buy” cycle, here’s how some our candidates have fared:
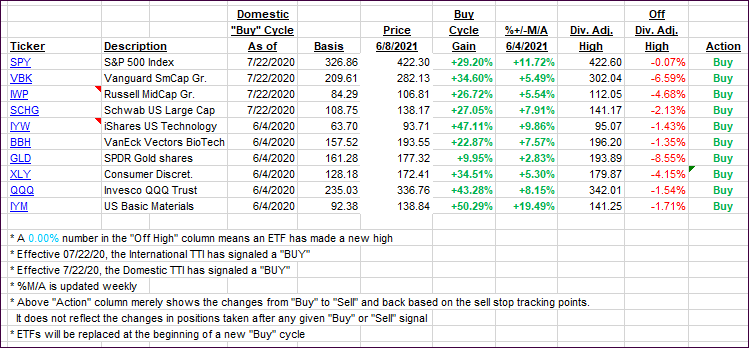
Click image to enlarge.
Again, the %+/-M/A column above shows the position of the various ETFs in relation to their respective long-term trend lines, while the trailing sell stops are being tracked in the “Off High” column. The “Action” column will signal a “Sell” once the -8% point has been taken out in the “Off High” column. For more volatile sector ETFs, the trigger point is -10%.
3. Trend Tracking Indexes (TTIs)
Our TTIs changed only immaterially as the sideways pattern continued.
This is how we closed 06/08/2021:
Domestic TTI: +16.87% above its M/A (prior close +16.73%)—Buy signal effective 07/22/2020.
International TTI: +15.53% above its M/A (prior close +15.77%)—Buy signals effective 07/22/2020.
Disclosure: I am obliged to inform you that I, as well as my advisory clients, own some of the ETFs listed in the above table. Furthermore, they do not represent a specific investment recommendation for you, they merely show which ETFs from the universe I track are falling within the specified guidelines.
All linked charts above are courtesy of Bloomberg via ZeroHedge.
Contact Ulli