
- Moving the markets
The Fed issued some market pleasing remarks early on sending the major indexes higher, with the S&P 500 notching another intra-day record. Fed head Powell uttered the words that traders wanted to hear, namely that they will maintain their easy monetary policies.
Added CNBC:
Powell said in his semiannual testimony before Congress Wednesday that the central bank can wait before it starts to ease its bond purchases despite surging inflation readings. The Fed chair said he still expects inflation to moderate.
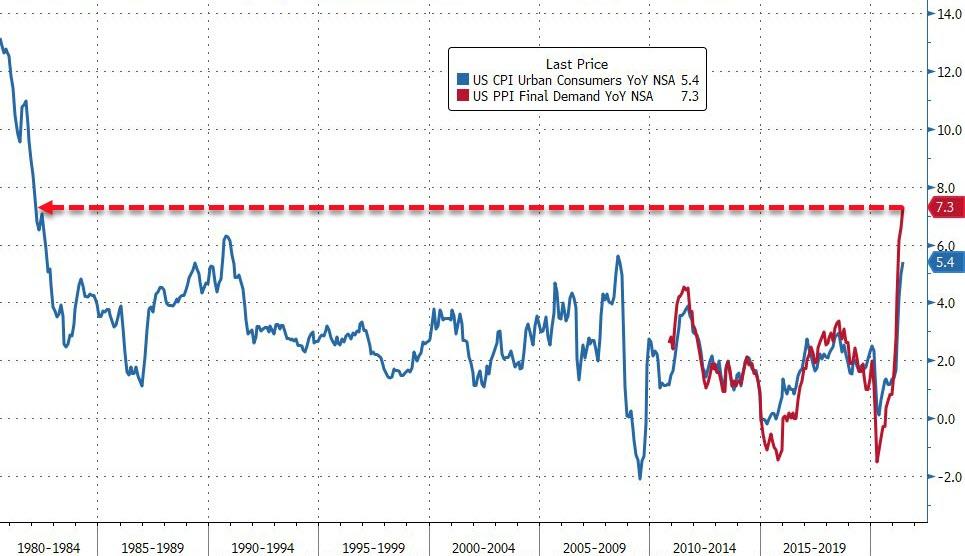
Though, hawkish Producer Price inflation (PPI) numbers, showing the index spiraling past expectations, up 1% MoM, rising 7.3% YoY (vs. 6.7% expected), took the starch out of the rally.
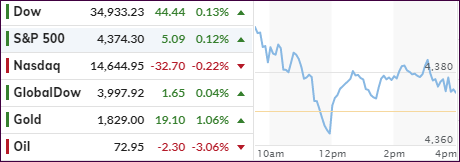
As a result, the early euphoria hit a brick wall, causing the markets to reverse and dump into the red. An afternoon rebound ensured a modest close above their respective unchanged lines, except for the Nasdaq, which lost a modest -0.22%.
Sure, we are supposed to believe that inflation is transitory, which I don’t agree with, and today, non-other than powerhouse Blackrock’s Larry Fink said: “I worry about inflation, it’s unlikely to be transitory.”
In terms of winners and losers on today’s roller coaster ride, Small Caps got hammered again (-1.65%) with “value” closing in the red as well, but with a lesser loss (-0.45%).
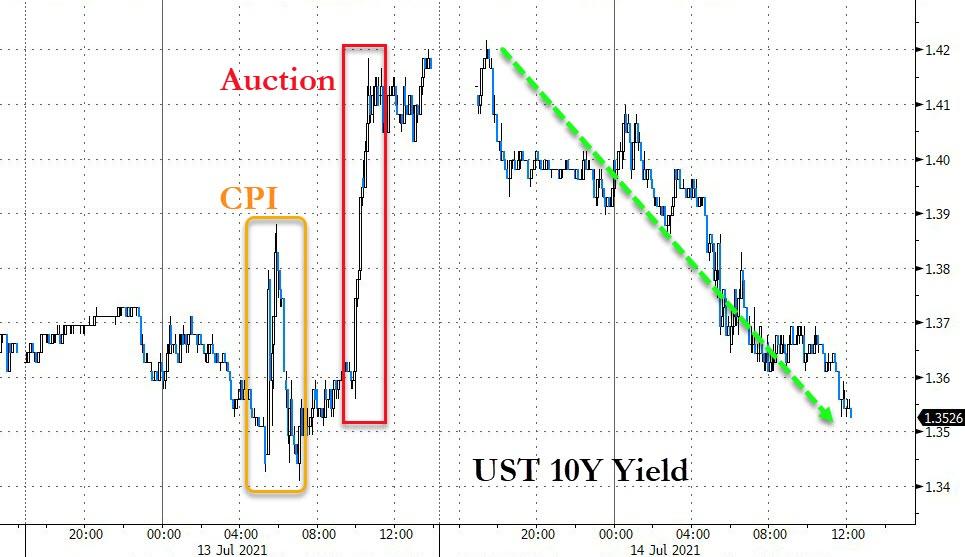
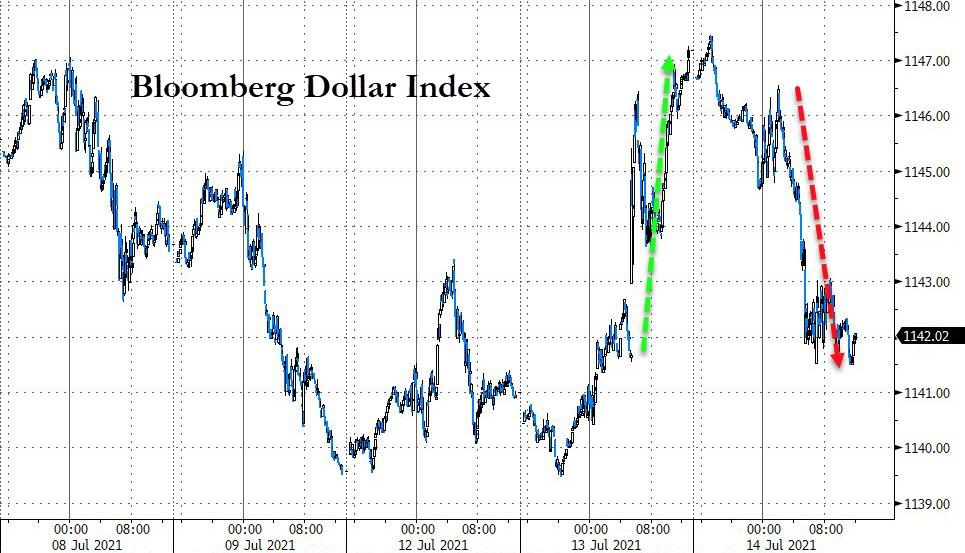
Bond yields collapsed, giving back yesterday’s gains, which was followed by the US Dollar. That combination gave Gold a reason to rally, and the precious metal added a solid +1.03% and thereby solidified its position above the $1,800 level.
I believe this session was saved by Powell’s dovish announcement which, at least for this day, dominated any inflationary concerns.
2. ETFs in the Spotlight
In case you missed the announcement and description of this section, you can read it here again.
It features some of the 10 broadly diversified domestic and sector ETFs from my HighVolume list as posted every Saturday. Furthermore, they are screened for the lowest MaxDD% number meaning they have been showing better resistance to temporary sell offs than all others over the past year.
The below table simply demonstrates the magnitude with which these ETFs are fluctuating above or below their respective individual trend lines (%+/-M/A). A break below, represented by a negative number, shows weakness, while a break above, represented by a positive percentage, shows strength.
For hundreds of ETF choices, be sure to reference Thursday’s StatSheet.
For this current domestic “Buy” cycle, here’s how some our candidates have fared:
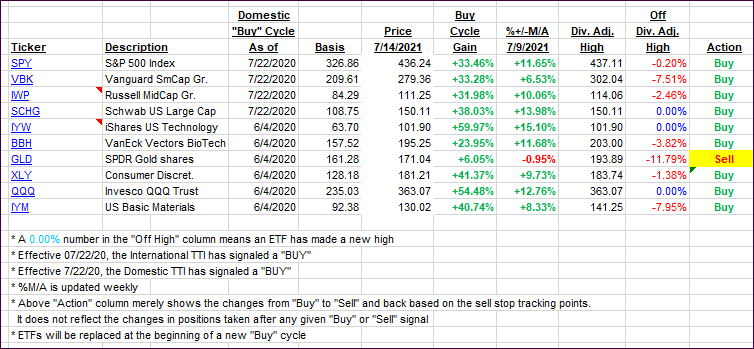
Click image to enlarge.
Again, the %+/-M/A column above shows the position of the various ETFs in relation to their respective long-term trend lines, while the trailing sell stops are being tracked in the “Off High” column. The “Action” column will signal a “Sell” once the -8% point has been taken out in the “Off High” column. For more volatile sector ETFs, the trigger point is -10%.
3. Trend Tracking Indexes (TTIs)
Our TTIs changed only irrelevantly.
This is how we closed 07/14/2021:
Domestic TTI: +11.49% above its M/A (prior close +11.66%)—Buy signal effective 07/22/2020.
International TTI: +8.66% above its M/A (prior close +8.45%)—Buy signals effective 07/22/2020.
Disclosure: I am obliged to inform you that I, as well as my advisory clients, own some of the ETFs listed in the above table. Furthermore, they do not represent a specific investment recommendation for you, they merely show which ETFs from the universe I track are falling within the specified guidelines.
All linked charts above are courtesy of Bloomberg via ZeroHedge.
Contact Ulli