
ETF Tracker StatSheet
You can view the latest version here.
CHUCKING INTO THE WEEKEND
- Moving the markets
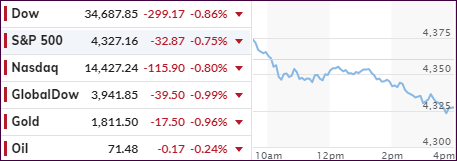
Despite an early bounce last Monday, the major indexes bobbed and weaved throughout the week, yet, as upward momentum was fading, so did the buying appetite, and we dumped into the weekend.
This snapped the Dow’s 3-week winning streak, as inflation fears took center stage and dominated strong retail numbers along with better-than-expected earnings reports. The S&P 500 surrendered around 1%, while the Nasdaq fared worse by giving back some 1.9%.
Not helping the bullish mood was the consumer sentiment report, which showed a drop from last month, against expectations of an increase, with economists now struggling to explain how they could be that far off.
The report also pointed to increasing inflation expectations by consumers, who now believe prices will head higher by some 4.8% over the next year. Apparently, they have not accepted the Fed’s non-stop jawboning that inflation is “transitory.”
Even funnier, I just heard that one of the Fed heads announced that inflation is in a “bubble” and may be pricked and subsequently deflated. Hmm, sounds like something that might be more applicable to the stock market.
In the end, considering the recent runup in equities, the losses were moderate but broad.
Small Caps, Value and Tech all slumped with value taking the biggest hit of -1.58%. That sector, despite still being the YTD leader, has struggled over the past few weeks.
The US Dollar stayed about even, bond yields dipped slightly, none of which was conducive to holding up Gold, which tumbled -0.95% on the session but remains above its much fought-over $1,800 level.
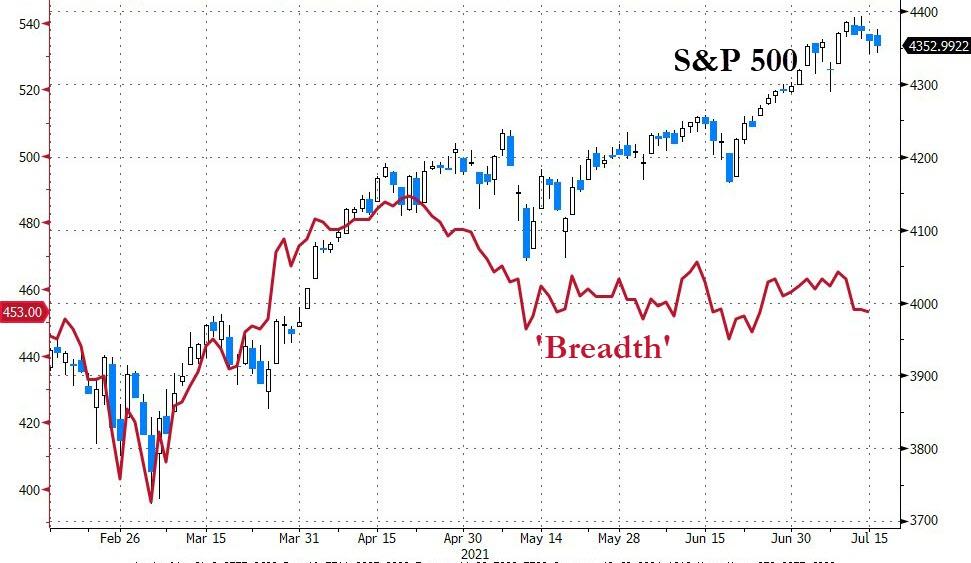
Again, ZeroHedge pointed to weakness in this recent rally due to a lack breadth. As you can see in this S&P 500 chart, the price and breadth (a measure of the number of stocks participating in a rally) diverged around the middle of April, thereby indicating that only a small percentage of them were responsible for the push higher.
Advances based on low breadth are known to be ephemeral.
2. ETFs in the Spotlight
In case you missed the announcement and description of this section, you can read it here again.
It features some of the 10 broadly diversified domestic and sector ETFs from my HighVolume list as posted every Saturday. Furthermore, they are screened for the lowest MaxDD% number meaning they have been showing better resistance to temporary sell offs than all others over the past year.
The below table simply demonstrates the magnitude with which these ETFs are fluctuating above or below their respective individual trend lines (%+/-M/A). A break below, represented by a negative number, shows weakness, while a break above, represented by a positive percentage, shows strength.
For hundreds of ETF choices, be sure to reference Thursday’s StatSheet.
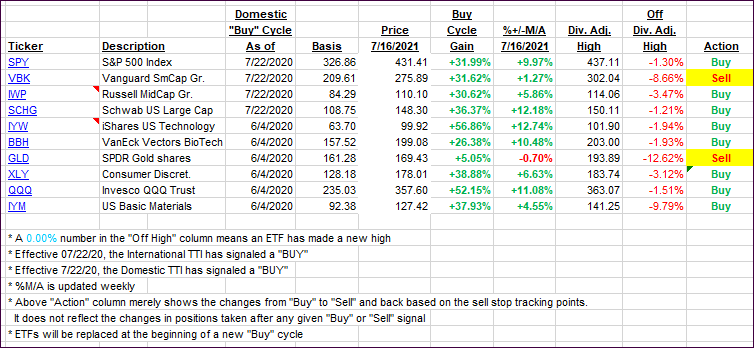
For this current domestic “Buy” cycle, here’s how some our candidates have fared:
Click image to enlarge.
Again, the %+/-M/A column above shows the position of the various ETFs in relation to their respective long-term trend lines, while the trailing sell stops are being tracked in the “Off High” column. The “Action” column will signal a “Sell” once the -8% point has been taken out in the “Off High” column. For more volatile sector ETFs, the trigger point is -10%.
3. Trend Tracking Indexes (TTIs)
Our TTIs retreated sharply, as the bears had the upper hand for most of this week.
This is how we closed 07/15/2021:
Domestic TTI: +9.59% above its M/A (prior close +11.49%)—Buy signal effective 07/22/2020.
International TTI: +6.47% above its M/A (prior close +8.66%)—Buy signals effective 07/22/2020.
Disclosure: I am obliged to inform you that I, as well as my advisory clients, own some of the ETFs listed in the above table. Furthermore, they do not represent a specific investment recommendation for you, they merely show which ETFs from the universe I track are falling within the specified guidelines.
All linked charts above are courtesy of Bloomberg via ZeroHedge.
———————————————————-
WOULD YOU LIKE TO HAVE YOUR INVESTMENTS PROFESSIONALLY MANAGED?
Do you have the time to follow our investment plans yourself? If you are a busy professional who would like to have his portfolio managed using our methodology, please contact me directly or get more details here.
———————————————————
Back issues of the ETF Tracker are available on the web.
Contact Ulli